One of the challenges in IT is getting your data replicated to a remote location for fail-over and data recovery if your main operations center is compromised. It is not sufficient to set up replication, you also have to watch closely whether your replication goals are met at all times.
Part 1 of this blog explored the various TS7700 replication modes. Part 2 explores how IntelliMagic Vision can be used to monitor the health of the TS7700 replication process.
TS7700 Replication Monitoring
The TS7700 keeps track of many performance statistics about its operation. A constant watch of these metrics is needed to make sure that performance and replication goals are being met. IntelliMagic Vision performs fully automated daily interpretation of all relevant performance statistics. It applies built-in intelligence about the hardware and workloads to rate the health of the clusters and flag exceptions in dashboards and charts. The enhanced metrics are put in a database that can also be used for ad-hoc reporting with easy-to-use graphical views.
IntelliMagic Vision comes with pre-defined “early warning” and “performance exception” thresholds for all sorts of metrics. As a user you can adjust these default thresholds to meet your standards and requirements. Graphs for time periods where the early warning threshold is exceeded will be bordered in yellow, while graphs that contain performance exceptions will be bordered in red. Automatic emailing of custom reports when early warnings and performance exceptions are found makes sure that the right people are notified.
There are a number of metrics that can looked at with IntelliMagic Vision to specifically monitor the TS7700 replication process. Three important ones will be covered here.
Replication Backlog
This is the amount of data (in GiB) that is scheduled to be copied to this cluster. This is one measure of how far behind the copy processes are. It can rise and fall depending upon the arrival of tape data that needs to be replicated. It is common to see this backlog rise during peak batch processing times and then decrease as batch processing is winding down and the online day starts.
Below is a sample chart from IntelliMagic Vision showing the Replication Backlog peaking for the two receiving clusters at about 5:00 PM, then rising and falling until about 6:00 AM, where it is mostly caught up.
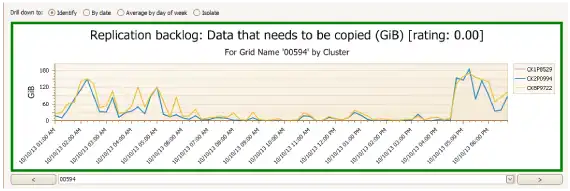
As long as replication catches up before the next peak cycle, this may be considered an acceptable backlog.
Average Immediate Queue Age
This is the average age (in seconds) of the logical volumes in the immediate copy queue destined to be copied TO this cluster. Note that the target cluster actually pulls the data from the source cluster so many of these statistics are from the perspective of the target or receiving cluster.
If only a small percentage of the replication is for immediate copies, you would expect this number to be relatively small, possibly in the order of 180 seconds or less. However, this will depend on the sizes of the virtual volumes as well as the latency in the network. For example, a 4000 MB virtual volume will take longer to copy than an 800 MB virtual volume.
Average Deferred Queue Age
This is the average age (in seconds) of the logical volumes in the deferred copy queue destined to be copied TO this cluster. One would expect that this would be higher than the immediate queue since immediate copies have priority over deferred copies. Also, many sites will have a greater proportion of their replications in the deferred copy mode.
Below is a sample chart of deferred queue ages from IntelliMagic Vision. In this example, tape data is replicated from the CK1 cluster to both the CK2 cluster and the CK3 cluster. Both the CK2 and the CK3 clusters have deferred queue ages approaching 600 seconds at a couple of times during this day. CK1 has zero deferred queue age since it is only sending data via copies, not receiving data via copies.
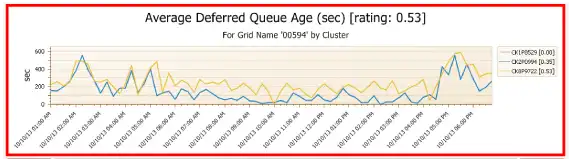
This particular chart uses a custom threshold of 300 seconds for an early warning and 360 seconds for a performance exception. IntelliMagic Vision has flagged this chart with a red border because the 360 second threshold is exceeded multiple times during this time frame.
TS7700 Replication Tuning
The TS7700 attempts to give priority to Host I/O transfers. As such, it may decide that it needs to slow down or throttle some of the other (background) tasks such as pre-migration and/or deferred copies. For a complete discussion of what causes deferred copy throttling to be turned on, please see the IBM White Paper – Understanding, Monitoring and Tuning TS7700 Performance available in Techdocs. Here, we’ll just talk about the deferred copy tuning parameters that can be altered by the user.
There are two parameters that can have an effect on deferred copy throttling.
Deferred Copy Throttling Average Threshold (DCTAVGTD)
This threshold is based on host compressed throughputs, i.e. host throughputs after the data has been compressed by a TS7700 Host Bus Adapter. The default for DCTAVGTD is 100 MB/sec. This default was probably appropriate for the Power5 versions of the TS7700 but is probably too low for the Power7 versions of the TS7700. I would consider setting DCTAVGTD to 200 MB/sec on the Power7 clusters. This would mean that DC throttling might only be invoked at higher host throughput levels. The user can change DCTAVGTD by using the Library Request command.
Deferred Copy Throttling Delay (DCT)
This threshold is the amount of delay that will be introduced for each block of data being replicated when Deferred Copy Throttling is being invoked. The default for DCT is 125 msecs which significantly slows down deferred copy activity. I would consider setting DCT to 30 msecs and then slowly lowering further, monitoring for any impact on host transfer activity. Some sites have even set DCT to zero, meaning there will be no deferred copy throttling. A lower DCT means that even when throttling is invoked, it will have a smaller impact on the deferred copy throughputs. The user can change DCT by using the Library Request command.
Replication Monitoring
So how would you know if your TS7700 was invoking deferred copy throttling? You can use IntelliMagic Vision to look at the charts shown below.
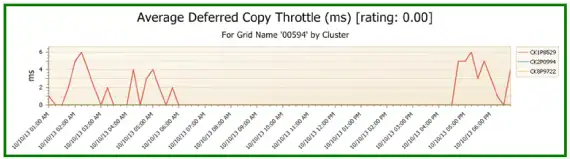
The first is the Average Deferred Copy Throttle chart. This is the average of the DC Throttle Delay value (which is evaluated every 30 seconds) over a 15 minute interval. In the sample below, DCOPYT was set to 6 seconds. Obviously, if this chart had all zero values, then there would have been no throttling.
There was some throttling from after 4:30 PM and from midnight to 6 AM. These roughly correspond to the higher Replication Backlogs and the longer Deferred Queue Ages that were seen in earlier charts. Note that the throttling is on the sending cluster (CK1) while Deferred Queue Ages are on the receiving clusters.
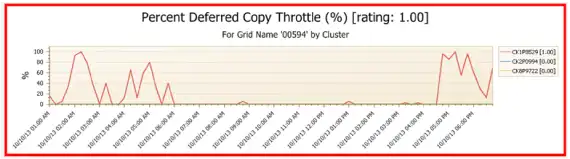
The second is the Percent Deferred Copy Throttle. This is the percent of 30 second periods within the 15 minute interval where throttling was being invoked. Again, these roughly correspond to the higher backlogs and queue ages seen earlier.
 Summary
 Summary
By monitoring items such as Replication Backlog, Average Immediate Queue Age, Average Deferred Queue Age, and Average Deferred Copy Throttle, you can determine whether the TS7700 replication process is meeting your goals. If your goals are not being met, you can alter some of the Deferred Copy Throttle tuning parameters and hopefully change the situation to meet your goals.
TS7700 Performance Analysis
This white paper demonstrates how you can be effectively monitor TS7700 tape subsystems and proactively identify any performance exceptions in your TS7700.
This article's author
Share this blog
Related Resources
How to Find Sick But Not Dead (SBND) TS7700 Tape Clusters
Rather than waiting for a remote VTS to fail, you should be reviewing these key TS7700 reports to determine if remote clusters are receiving replication data or not.
Are My Remote Clusters Receiving Replication?
Review these key reports when troubleshooting remote cluster issues or trying to determine if your remote clusters are receiving replication.
TS7700 Synchronous Mode Copy Benefits
Compared to a reduced RPO, a lesser-known benefit to using Synchronous Mode is a more efficient cache flow and therefore a more efficient utilization of the disk cache.
Book a Demo or Connect With an Expert
Discuss your technical or sales-related questions with our mainframe experts today