
Infrastructure teams today commonly face the barrier of learning different tooling if they want to collaborate with other teams and view SMF data types created by other components. This leads to the undesirable outcome of not having access to insights that are available from other SMF data types. Instead, teams are “handcuffed” by having to hand questions off to other areas to analyze other SMF data types using tooling specific to that discipline. This obstacle can be overcome through a common, intuitive, integrated interface that gives all teams visibility into the insights provided by components across the entire z/OS platform.
As sysplexes have evolved, the amount of communication and sharing across the systems has increased dramatically, facilitated by two key components:
- the Coupling Facility that maintains shared control information (e.g., database locks)
- XCF (Cross-System Coupling Facility) that facilitates point-to-point communication between members of a group (or expressed another way, to other address spaces utilizing a common application)
Coupling facility metrics are relatively well known, but XCF metrics (from RMF 74.2 records) have typically received less visibility.
The examples in this blog demonstrate how intuitive visibility into XCF message volumes combined with metrics from various XCF callers help provide a complete picture of the services XCF is performing and enable analysts to ensure those services are operating as efficiently as possible.
Oft-Ignored XCF Can Generate High CPU
XCF is exceptionally good at reliably delivering messages at high volumes. In the environment shown in Figure 1, total volume occasionally exceeds 100K per second. I have seen rates surpassing 250K per second.
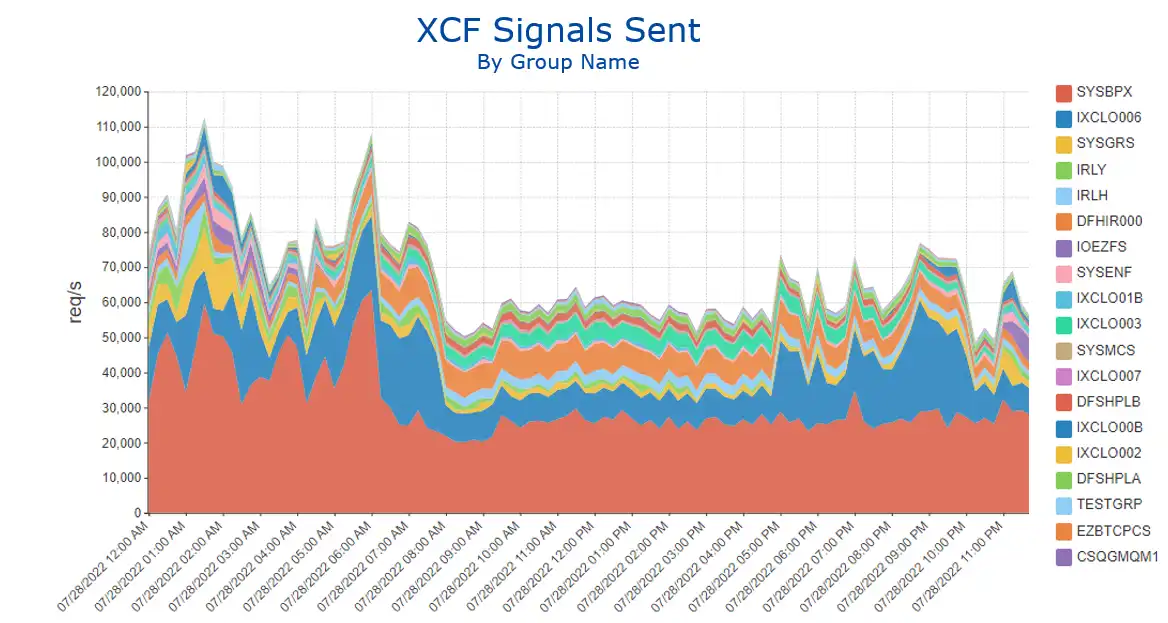
Figure 1: XCF Signals Sent by Group (area chart)
However, because XCF is so good at its job, it is often ignored. The problem with that is that sending and receiving high volumes of messages drives CPU, both for XCFAS as well as the address spaces processing the messages. As a result, system configuration decisions that generate unnecessarily high message volumes can waste a significant amount of CPU.
Another reason that XCF is often ignored is that the RMF XCF reports are prime examples of the limitations of static reports.
Frank Kyne reported that he has seen a customer’s XCF report for a single day that was nearly five million lines long. In a world where the goal is to design “user friendly” interfaces, Frank’s description of RMF XCF reports is “user hostile.”
Integrating XCF Message Volumes and RMF Data for CPU Savings
Figure 2 shows ”XCF Signals Sent” in a line chart to identify the groups generating the most XCF activity. Some group names are self-explanatory (e.g., SYSGRS).
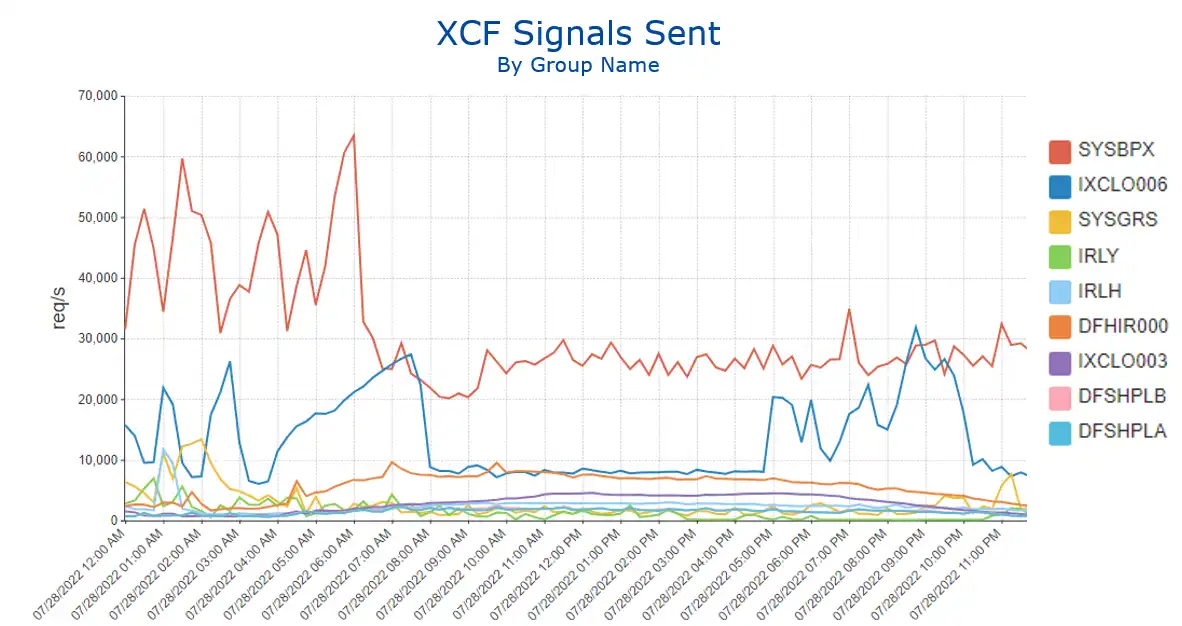
Figure 2: XCF Signals Sent by Group (line chart)
If the application correlated with the group name is not immediately apparent, as is potentially the case with the top message driver in this environment, SYSBPX, the RMF 74.2 data can “come to the rescue” since it captures the address space name of the XCF caller. In this case the address space name is OMVS, identifying these messages as being driven by Unix System Services.
Viewing the SYSBPX message volumes over multiple days by member name (which for this XCF group corresponds to the system ID) shows daily spikes at 6 AM for systems 7 and 9 (Figure 3).
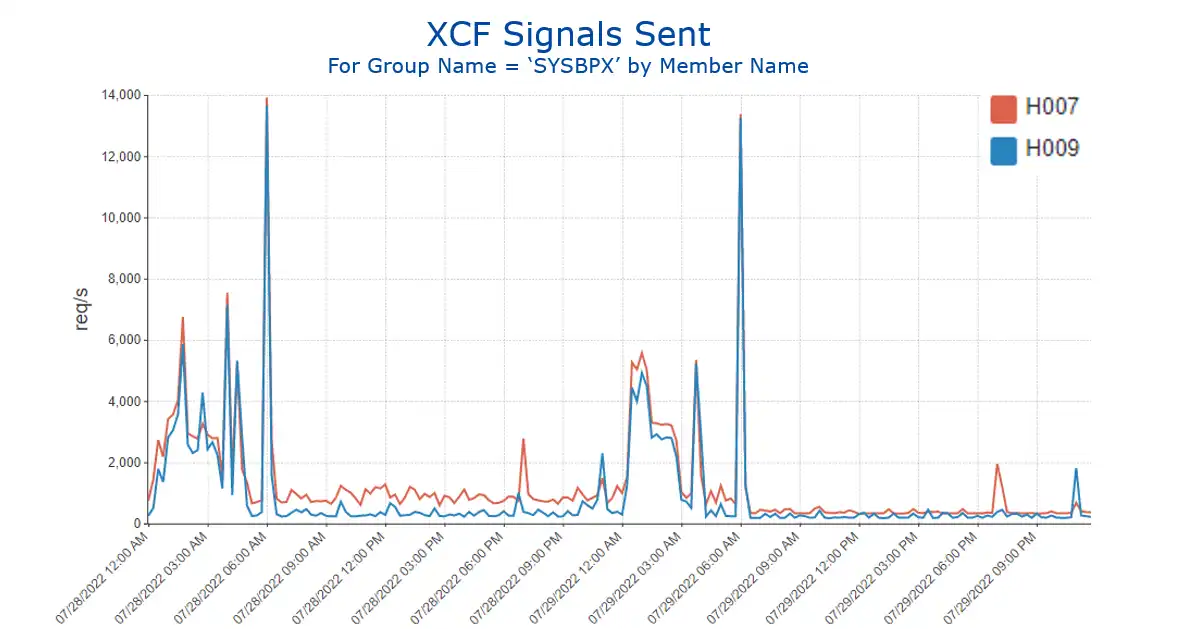
Figure 3: XCF Signals Sent by Group SYSBPX by Member Name
Data from RMF 72.3 and SMF 30 records can now be leveraged to view the CPU impact of these spikes in message volumes. In this environment both XCFAS and OMVS are in the SYSTEM service class.
Viewing CPU usage for that service class by address space name (Figure 4) shows spikes exceeding 60 MSUs at those times on those two systems, more than double the steady state usage.
In the past I have observed similar XCF message and CPU spikes when the OMVS file system is mounted on one system and file maintenance activity is kicked off on a system other than where the file system was mounted.
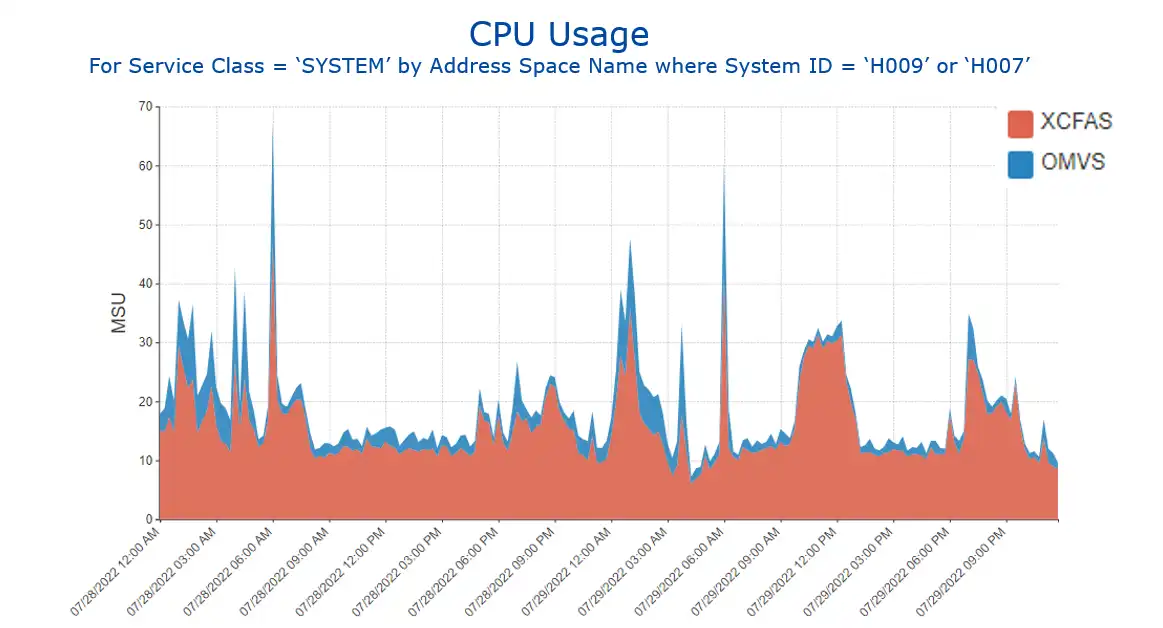
Figure 4: CPU Usage for Service Class ‘SYSTEM’ by Address Space Name for selected systems
This is one example where easy visibility into XCF message volumes and other RMF metrics can be used to identify a potential CPU efficiency opportunity.
XCF ISTXCF Group Can Represent Opportunity for CPU Efficiency
Another type of XCF message that can represent a sizable CPU savings opportunity is ISTXCF, used by VTAM and TCP/IP networking. On the prior system, ISTXCF didn’t make the top 20. But Figure 5 shows another site where there are far more ISTXCF messages than any other XCF group.
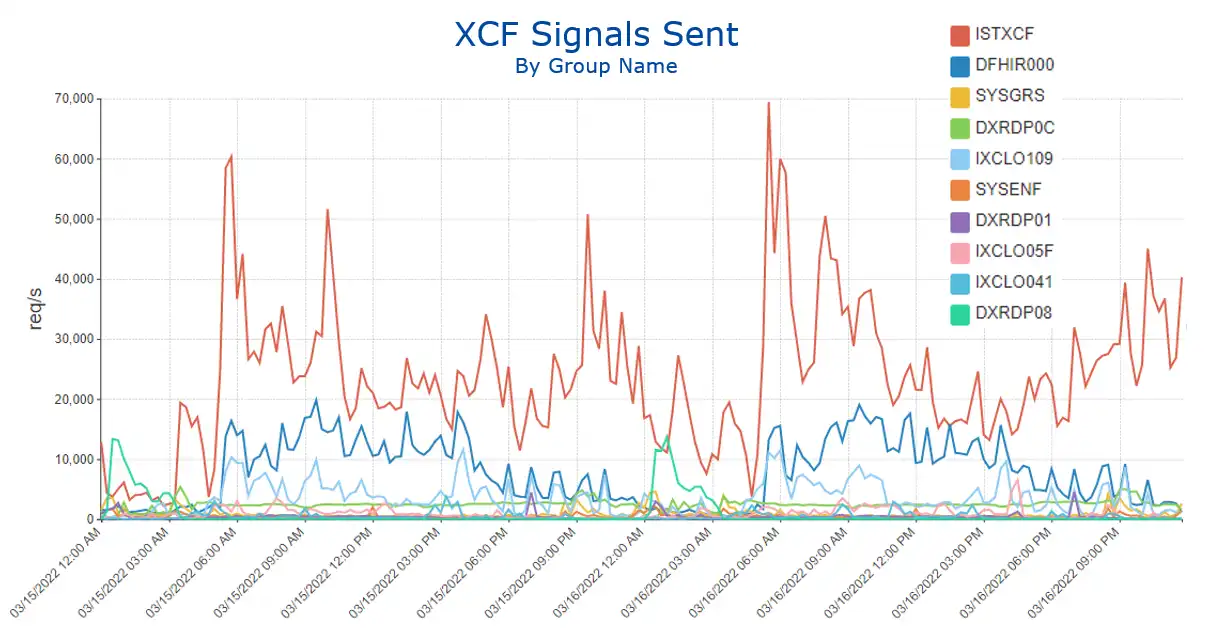
Figure 5: XCF Signals Sent by Group
IBM’s TCP/IP documentation indicates that TCP/IP takes advantage of XCF communication capabilities in three ways:
- It maintains awareness of the status (health) of a TCP/IP instance within the sysplex.
- It determines workload levels within each LPAR in the sysplex through Workload Manager (WLM).
- It can send IP traffic among the LPARs.
A SHARE presentation from IBM Comm Server expert Gus Kassimis contained the graphic found in Figure 6 (I added the red highlighting).
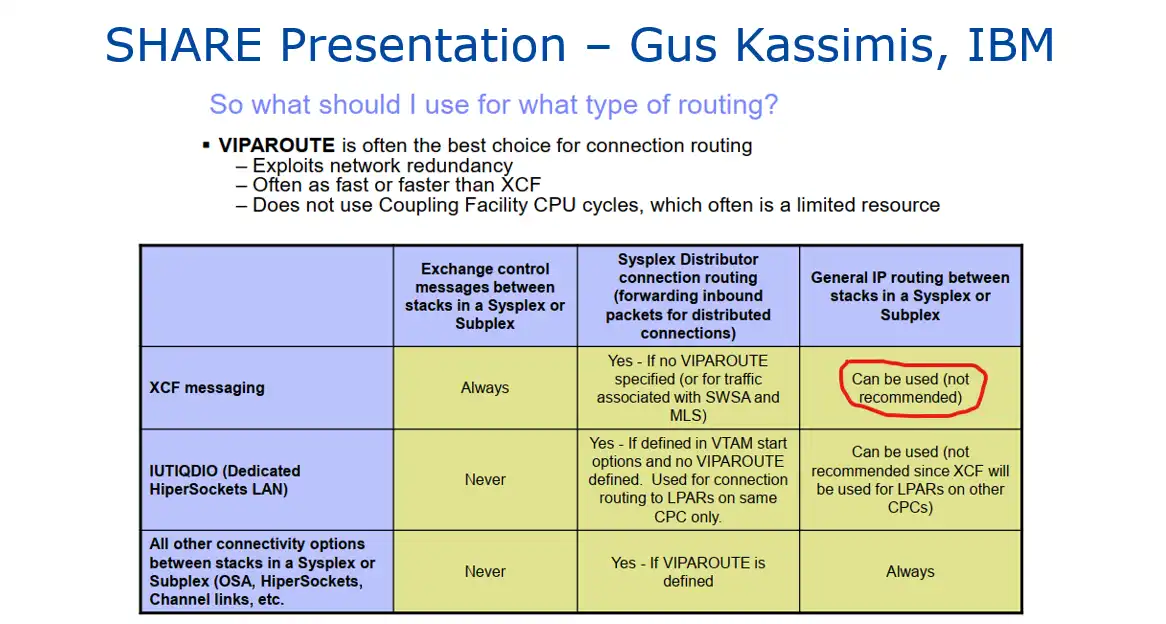
Figure 6: Sysplex Networking Technologies and Considerations, SHARE in Seattle, March 2015, p. 32.
At a previous employer we encountered a jump in XCFAS CPU that was traced back to a spike in XCF message volume isolated to group ISTXCF. Collaboration with the Network team identified that the Sysplex Distributor configuration had been updated to use XCF instead of VIPAROUTE. When that was changed to its original setting, there was a 600 MIPS CPU savings across the XCFAS and TCPIP address spaces. (For more details see article “TCP/IP and XCF” in the User Experiences section of Cheryl Watson’s Tuning Letter, 2015 No. 1, pp. 32-34.)
Analysis Enhanced through Viewing Multiple Types of SMF Data
These use cases illustrated how having easy visibility to XCF message volumes can be leveraged to and partner across disciplines to identify potential CPU savings opportunities.
Subsequent blogs in this series will provide additional examples of real-life scenarios where visibility into insights derived from multiple types of SMF data enhances analysis by providing a more complete perspective into the operation of a z/OS environment.
Previous blogs showed how multiple data types help tell the complete story for Missed WLM Goals and CICS Transaction data and Address Space and Db2 Accounting data.
This article's author
 Todd Havekost
 Share this blog
Related Resources
Using New XCF Metrics to Optimize XCF Buffer Use
Gain a better understanding of the latest XCF metrics and learn how they can help you align your sysplex.
Insights into New XCF Path Usage Metrics | IntelliMagic zAcademy
Gain a better understanding of how XCF operates in general, tips about how to optimize their environment for the new paradigm, and information about what can be learned from the new Path Usage metrics.
XCF - A Reliable (But Often Overlooked) Component of Sysplex
Gain insights on things to watch out for when tuning and managing XCF and tips to optimize your sysplex.
Book a Demo or Connect With an Expert
Discuss your technical or sales-related questions with our mainframe experts today