
Following up on my first blog covering integrated visibility into WLM and CICS data, this blog continues our series demonstrating how mainframe performance analysis is enhanced by having integrated visibility into SMF data across data types. In this blog I’ll demonstrate how address space (SMF 30) and Db2 Accounting (SMF 101) data complement one another and provide a more complete “big picture” view than is available from either data source on its own.
Infrastructure teams today commonly face the barrier of learning different tooling if they want to collaborate with other teams and view SMF data types created by other components. This leads to the undesirable outcome of not having access to insights that are available from other SMF data types. Instead, teams are “handcuffed” by having to hand questions off to other areas to analyze other SMF data types using tooling specific to that discipline. This obstacle can be overcome through a common, intuitive, integrated interface that gives all teams visibility into the insights provided by components across the entire z/OS platform.
Address Space (SMF 30) and Db2 Accounting (SMF 101) data each provide useful insights necessary for data analysis, and in some use cases may be all you need. However, in certain situations, such as trying to understand Db2 batch job activity, gaining a complete “big picture” view often requires visibility provided from both data sources.
Scenario 1: Address Space Perspective (SMF 30)
One “workhorse” source of insights into the operation of a z/OS system comes from SMF 30 records that provide data by address space at job, interval, or step levels. But for Db2 batch jobs, one challenge with only having this view is that all the activity is rolled up into a step record with PGM=IKJEFT01. This has valuable data for many z/OS metrics such as CPU and I/O, but gives little idea of the nature of the Db2 activity that is taking place (e.g., getpages, SQL statements).
Figure 1 shows a list of top jobs by total CPU consumption that are executing PGM=IKJEFT01.
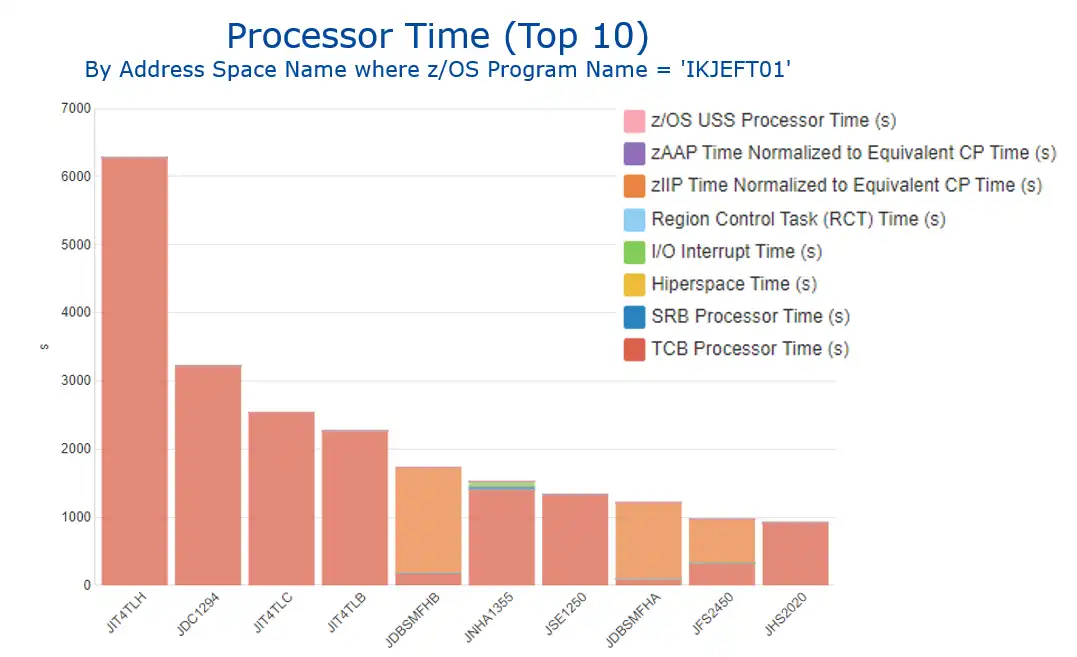
Figure 1: Processor Time (Top 10)
This excerpted view of the step termination records (sorted by descending CPU usage) for a selected job shows that most of the CPU and elapsed time occurs in two of the more than 100 steps (Figure 2).
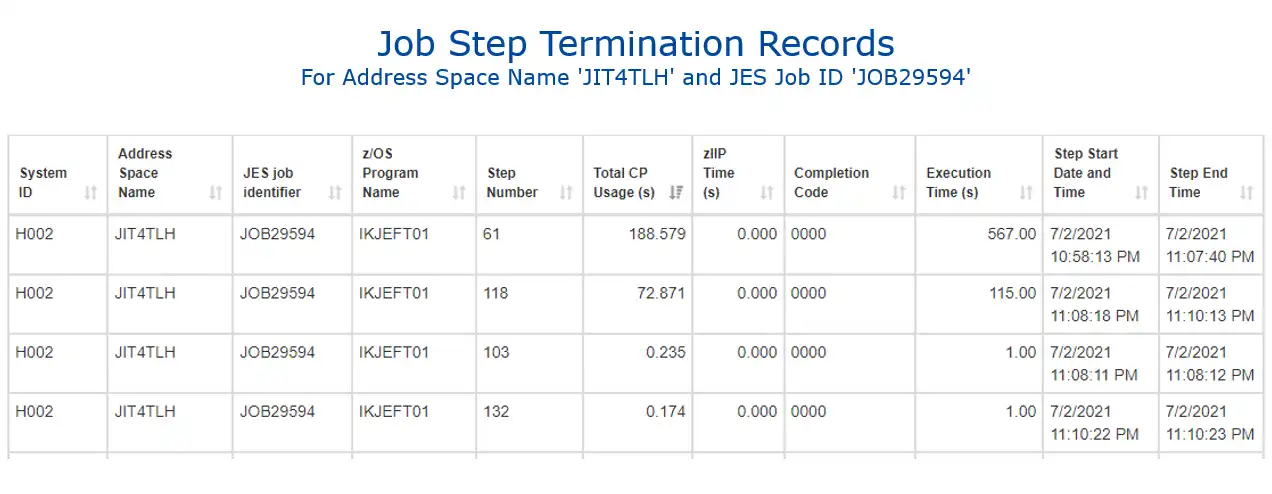
Figure 2: Job Step Termination Records (excerpt)
If the z/OS team is limited to viewing SMF 30 address space data, that is the extent of what can be determined about this job. But if the team also has easy access to view Db2 accounting data, many more insights become available.
Scenario 1: Db2 Accounting Perspective (SMF 101)
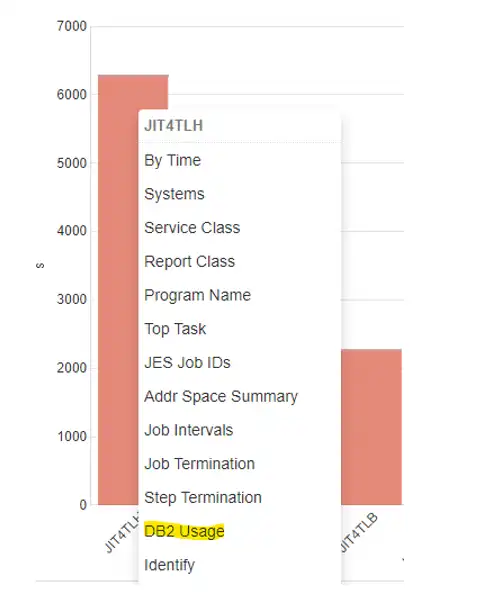
Figure 3: “Db2 Usage” drill down
Figure 3 illustrates how analysis can proceed directly (from Figure 1) by leveraging the fact that for several connection types, including Db2 Call Attach which is commonly used by jobs, Db2 captures the z/OS job name in the correlation name field.
Matching up the Db2 accounting data for this job enables new potential analysis into Db2 activity, including logging, row activity, getpages, and prefetch requests as seen below in Figure 4.
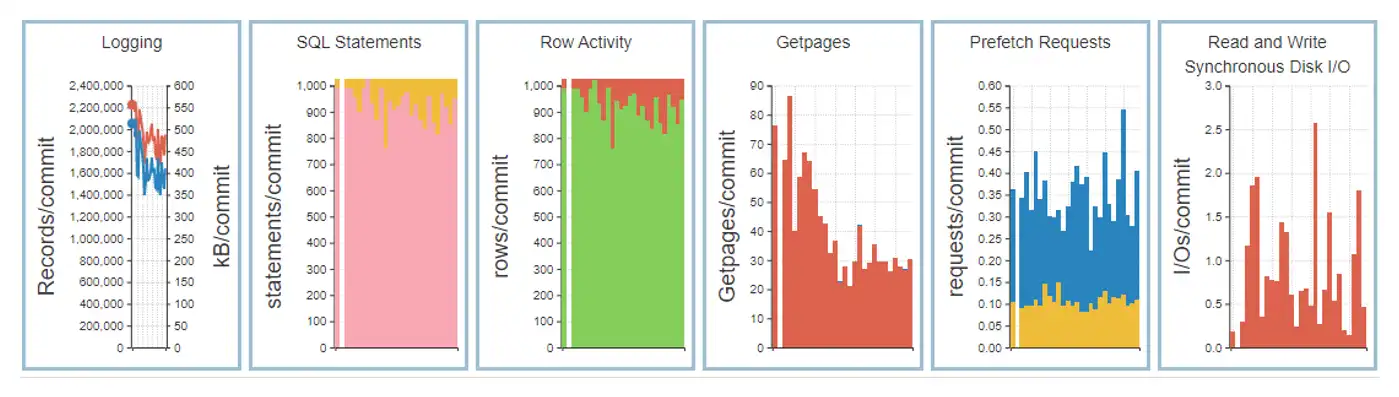
Selecting and expanding the view of SQL Statements indicates that these jobs are generating approximately 1000 SQL Fetch commands per commit and an equivalent number of SQL Delete commands (Figure 5).
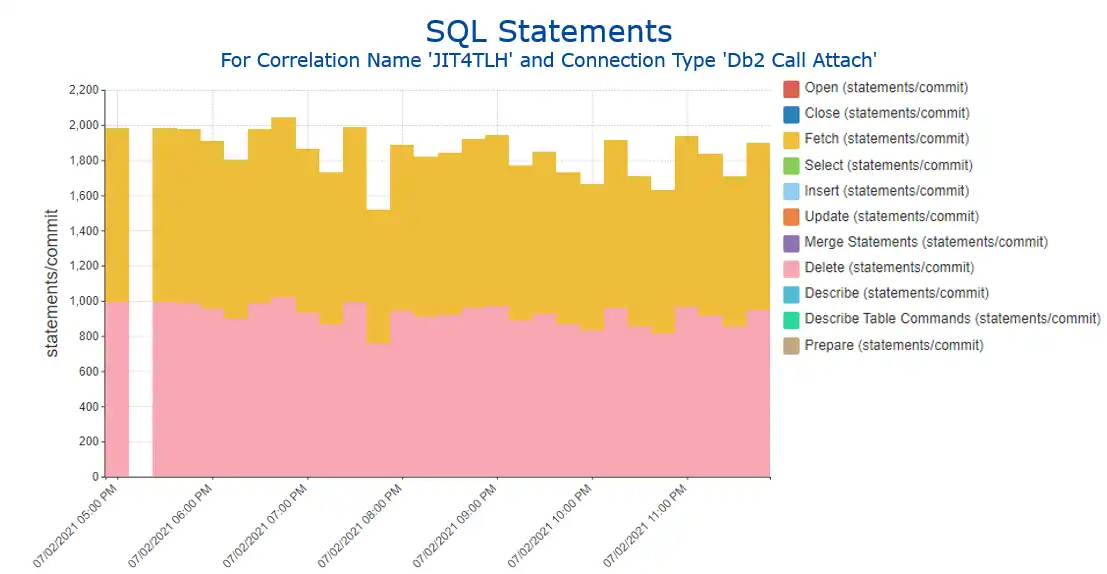
Figure 5: SQL Statements
This illustrates how Db2 accounting (Db2 101) data can provide extensive insights on what is happening within Db2 that is not available from address space (SMF 30) data.
Scenario 2: Db2 Accounting Perspective (SMF 101)
But Db2 accounting data has its own limitation. It does not generate interval data, but instead its data is only written at thread termination. This means that long-running work may only generate a single set of accounting metrics at end of job, providing no insights into the level of activity across the life of the job.
Starting from a view of top CPU consuming Db2 Call Attach jobs, a user may want to identify activity over time for a selected job (Figure 6).
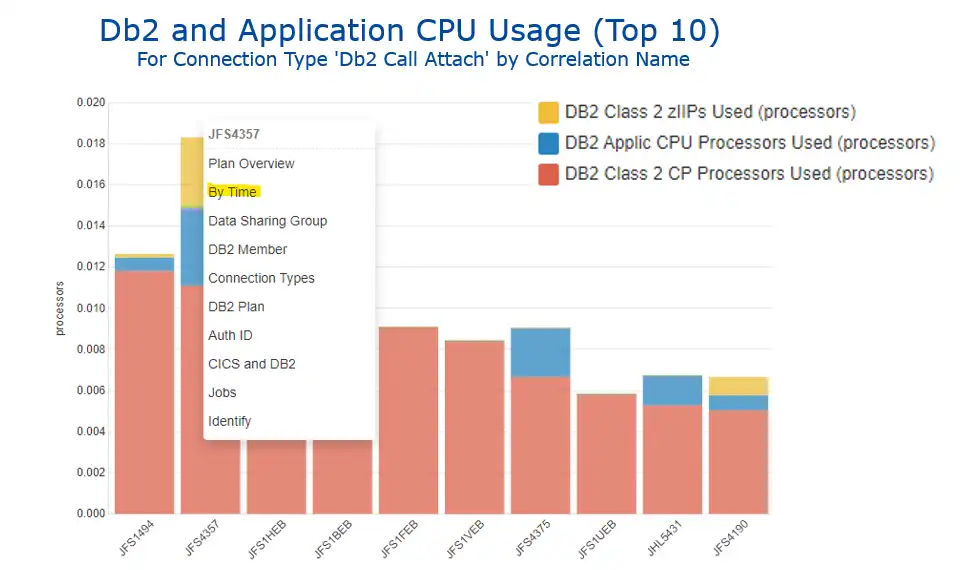
Figure 6: Db2 and Application CPU Usage (Top 10)
Since accounting data is written only at thread termination, the resulting view (Figure 7) reports all data at end of job and provides no visibility into the level of activity over the more than one hour duration of the job.
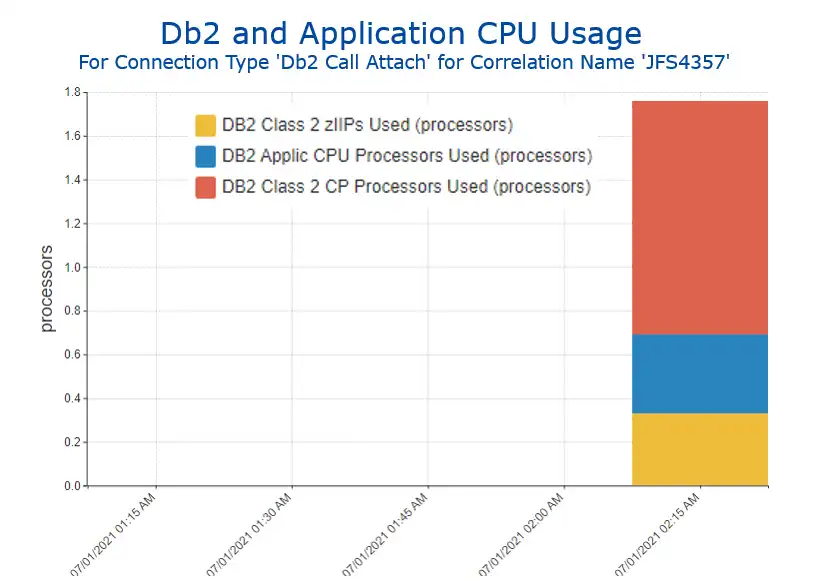
Figure 7: Db2 and Application CPU Usage for selected job
Scenario 2: Address Space Perspective (SMF 30)
Figure 8 illustrates how analysis might proceed by moving from the Db2 accounting data into SMF 30 address space data where its interval recording can fill in this gap.
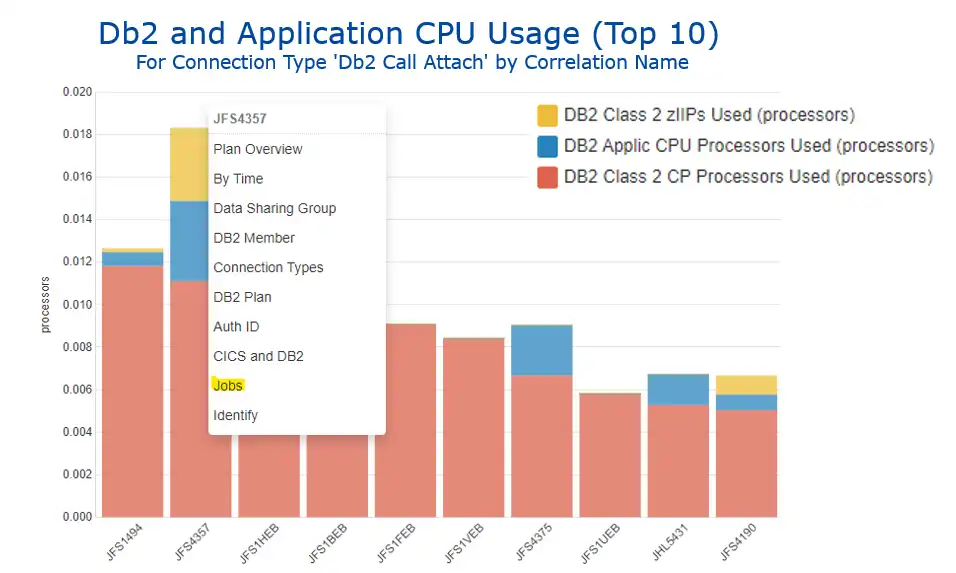
Figure 8: Db2 and Application CPU Usage (Top 10)
Indeed, the SMF 30 interval data comes to our rescue, indicating steady levels of GCP and zIIP CPU over the duration of the job, as well as increasing time consumed by disk I/O operations in latter time intervals (Figure 9).
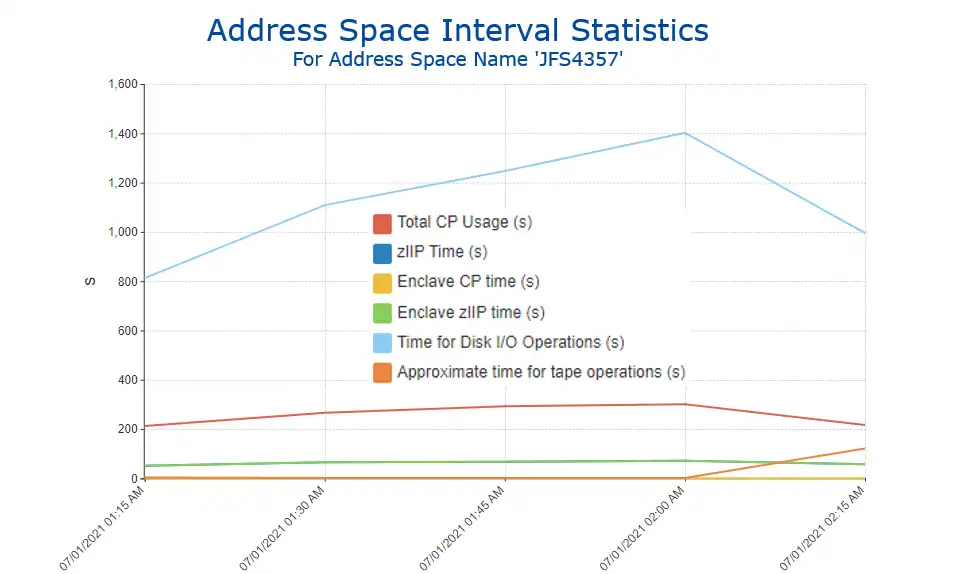
Figure 9: Address Space Interval Statistics
Analysis Enhanced through Viewing Multiple Types of SMF Data
This use case illustrated how having a common interface across data types enhanced analysis by enabling z/OS and Db2 teams to gain a more complete picture of the activity of Db2 jobs by having easy access to both address space (SMF 30) and Db2 accounting (SMF 101) data.
Subsequent blogs in this series will provide examples of other real-life scenarios where visibility into insights derived from multiple types of SMF data enhances analysis by providing a more complete perspective into the operation of a z/OS environment.
The below video demonstrates the navigation involved in creating these views using IntelliMagic Vision for z/OS.
This article's author
 Todd Havekost
 Share this blog
Related Resources
What's New with IntelliMagic Vision for z/OS? 2024.2
February 26, 2024 | This month we've introduced changes to the presentation of Db2, CICS, and MQ variables from rates to counts, updates to Key Processor Configuration, and the inclusion of new report sets for CICS Transaction Event Counts.
Viewing Connections Between CICS Regions, Db2 Data Sharing Groups, and MQ Queue Managers
This blog emphasizes the importance of understanding connections in mainframe management, specifically focusing on CICS, Db2, and MQ.
What's New with IntelliMagic Vision for z/OS? 2024.1
January 29, 2024 | This month we've introduced updates to the Subsystem Topology Viewer, new Long-term MSU/MIPS Reporting, updates to ZPARM settings and Average Line Configurations, as well as updates to TCP/IP Communications reports.
Book a Demo or Connect With an Expert
Discuss your technical or sales-related questions with our mainframe experts today