
All flash and hybrid flash arrays are becoming more the norm than the exception in the datacenter. The cost of the drives goes down while the capacity increases, almost monthly. It is tempting to assume that the blinding speed that SSDs deliver eliminates the need to keep an eye on basic storage monitoring.
Speed is the paint that covers many things, but it can mask other issues. This can make the performance from your flash drives not so… flashy. The bottleneck can often shift to another point in the system.
Where did my Flash go?
The below group of IntelliMagic Vison minicharts shows a VSP G1500 showing high read and write throughput accompanied by high read response times. These are indicated by the black arrows.
The red and yellow borders around each chart show the level of risk associated with each chart. Red indicates a high risk, yellow a moderate risk, and green means no risk during the time period.
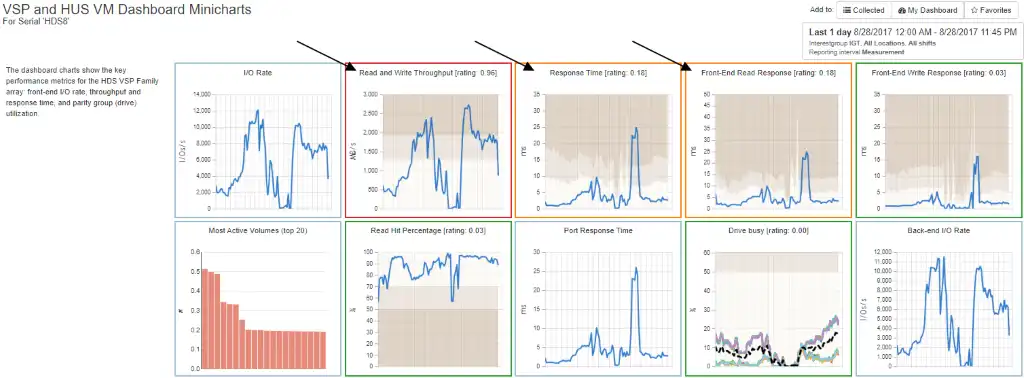
Figure 1: VSP and HUS VM Dashboard Minicharts
A knee-jerk reaction would be to blame the back-end disks, but a quick drilldown into the drive busy rating chart, shown in Figure 2, indicates low to moderate disk utilization.
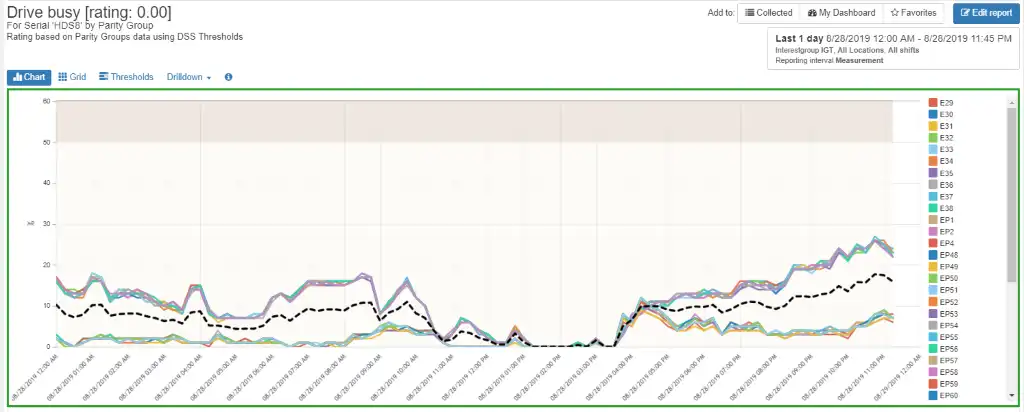
Figure 2: Drive utilization
They are only roughly 20% busy on average and the peaks on the graph do not correlate with the observed peaks in throughput or response time shown in Figure 1. Furthermore, the green border of the chart indicates that the drives are operating within specifications.
There it is…
Further inspection of the minicharts shows a peak in port response time, indicated by the red arrow in Figure 3, that corresponds to the peaks in read response times previously noted.
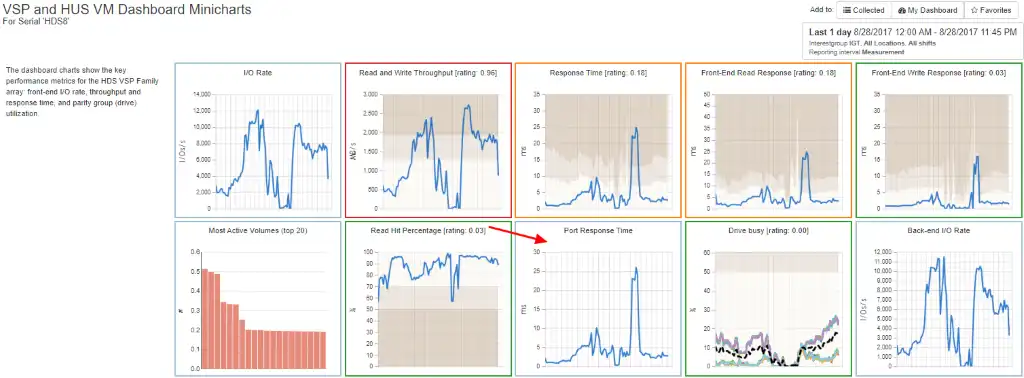
Figure 3: Port Response Time
Drilling down from the minichart to the port response time graph (Figure 4) gives more detail and shows the timing matches exactly.
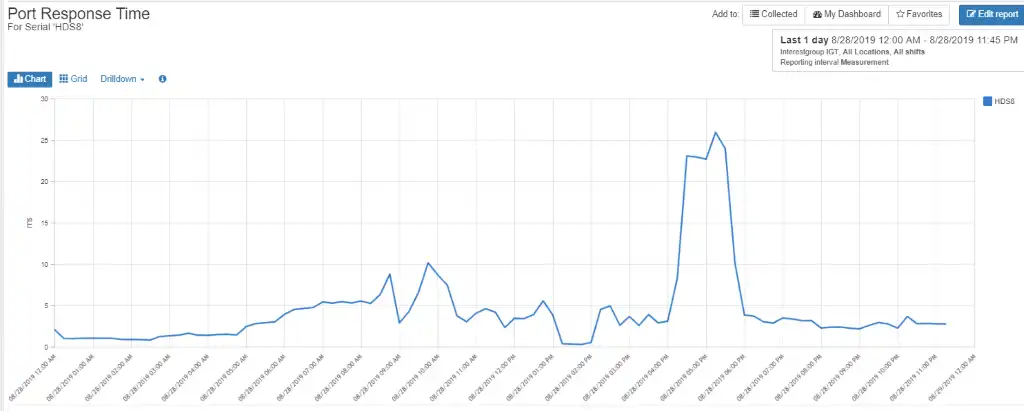
Figure 4: Aggregate Port Response Time Graph
Drilling into the Port Response Time graph into the individual ports (Figure 5) shows that the four host ports are heavily utilized during this time, with port CL1-D being most heavily hit.
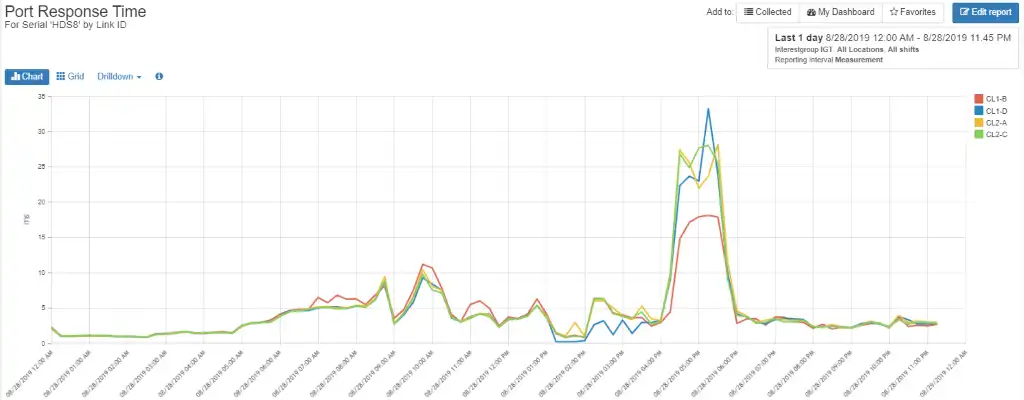
Figure 5: Individual Port Response Time
Looking at the negotiated port rate for each host port in Figure 6 shows that each of the ports negotiated at 8 Gbps while they are capable of 16 Gbps, rendering them unable to perform at their full potential.
The Brocade switches to which they are connected are only capable of 8 Gbps, so the host ports are constrained by connected infrastructure. The bottleneck has moved from the array to the switch.
Resolving this would require migrating the host ports to a switch capable of 16 Gbps. Obviously, while feasible, this is not something that can be quickly corrected.
| Link ID | WWPN for Port | Data rate for port | Port technology | Operational Status for Port |
| CL1-D | 50:06:0E:80:31:AC:D6:44 | 8Gbs | FC | OK |
Figure 6: Connected Port Rate
We’re not out of options, however. If we drill down further we can see the host groups that contribute to the port utilization during the peak time. For example, Figure 7 shows the host groups associated with port CL2-C.
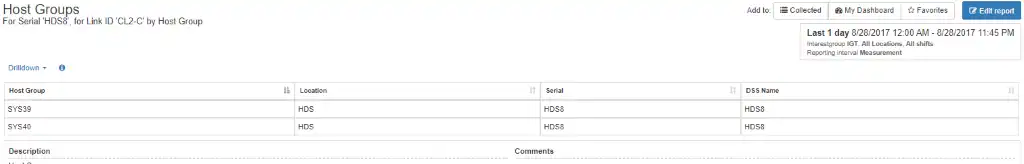
Figure 7: Host Groups
After compiling the information for each port, we found that each port has two masking views, for a total of eight masking views. The hosts associated with these asking views had a simultaneous spike in throughput resulting in constrained front-end ports. A graph for one of the masking views is shown below in Figure 8.
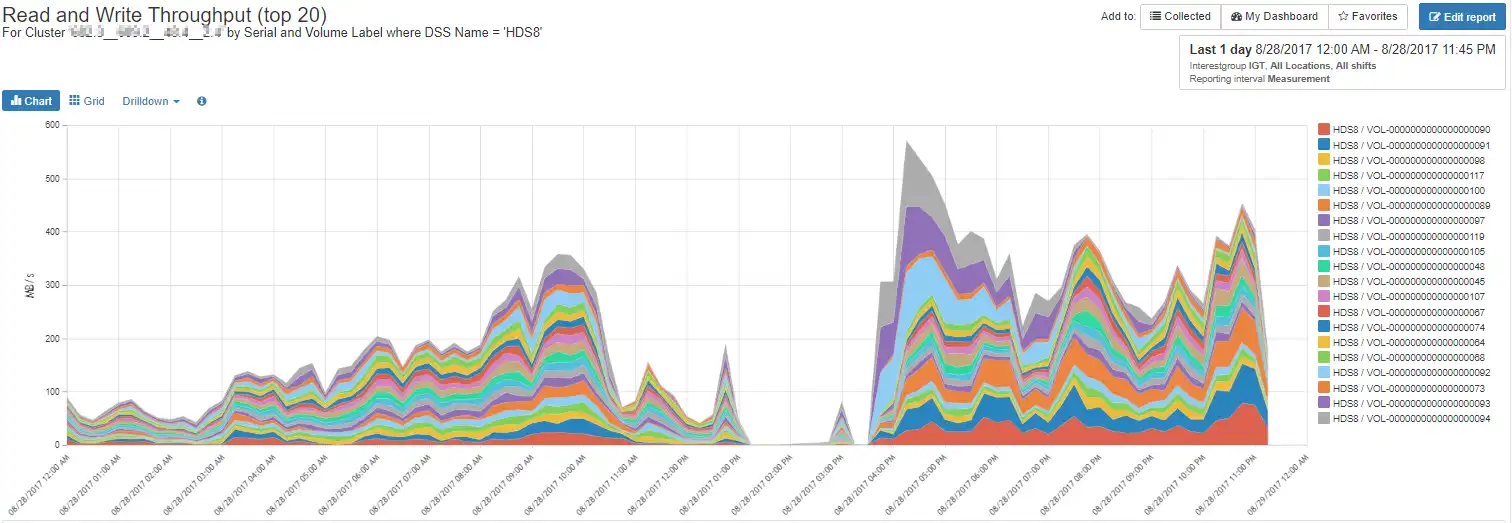
Figure 8: Host Spike
Since these eight masking views simultaneously increased throughput during the same time period with roughly the same intensity, the workloads are most likely related, and the server owners should be contacted to see what could be done to mitigate spikes of this nature.
Restoring the sparkle to your Flash
This brief blog shows how even though you may have an all flash/hybrid flash array, sometimes the bottleneck can move elsewhere in the data stream. IntelliMagic Vision makes it easy to isolate these issues and create an action plan for resolution.
This article's author
 Tim Chilton
 Share this blog
Related Resources
How to Detect and Resolve “State in Doubt” Errors
IntelliMagic Vision helps reduce the visibility gaps and improves availability by providing deep insights, practical drill downs and specialized domain knowledge for your SAN environment.
Finding Hidden Time Bombs in Your VMware Connectivity
Seeing real end-to-end risks from the VMware guest through the SAN fabric to the Storage LUN is difficult, leading to many SAN Connectivity issues.
Platform-Specific Views: Vendor Neutral SAN Monitoring Part 2
Each distributed system platform has unique nuances. It's important for a solution to be capable of getting the detailed performance data capable of supporting vendor-specific architectures.
Request a Free Trial or Schedule a Demo Today
Discuss your technical or sales-related questions with our availability experts today