
When large scale disk storage systems were originally introduced, a volume, as seen by the operating system, corresponded to a physical disk drive. The IBM 3390 is considered the last of these “SLEDs” (Single Large Expensive Disks) in the mainframe world. To this day, mainframe volumes are still configured as multiples of the 3990 form factor. Although advanced for their time, SLEDs had issues with respect to performance, reliability, and capacity.
To overcome these deficiencies, z/OS disk storage systems evolved to include reliability features such as RAID (Redundant Array of Independent Disks), performance features such as striping and PAVs (Parallel Access Volumes), and capacity features such as EAVs (Extended Address Volumes).
These changes caused the one-to-one relationship between volumes and disk drives to break down. Today, the operating system sees volumes as logical entities composed of storage collected across many physical devices.
This has created significant benefits to system performance and availability but has also introduced complexity. If you find elevated response time on a logical volume, how do you know which physical drives may be causing it?
Logical Volume Mapping
Storage systems map many logical volumes to other logical constructs that may be referred to as extent pools or disk groups or policies. The pools are composed of chunks of physical space spread across many disks or RAID groups as shown in the picture below.
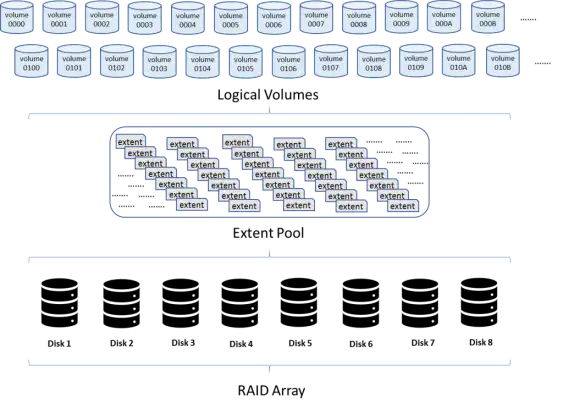
In these types of implementations, the data for each logical volume is spread over many or all physical disks in the pool. Each pool is based on multiple physical disks and may consist of multiple RAID arrays. This means that a single logical disk should typically not cause a single physical disk to become very busy. However, hot spots may still happen due to planning deficiencies or simple bad luck.
Because physical disks can be very large, many logical volumes are mapped to one group of physical disks. The resulting I/O density for the underlying disks may cause problems, especially with poor cache locality (data bases) or with high write data rates (batch workloads).
Avoid Disk Workload Imbalances
To avoid such problems, it is very important to balance the workload uniformly over all the disks in a disk system. Without this balance, you will not be able to exploit all the potential that the hardware offers, and performance bottlenecks may occur.
IntelliMagic Vision provides insight into the relationships between the physical and logical resources as well as the necessary performance measurement so that users can understand imbalances between the volumes, pools, and supporting drives or RAID groups. The chart below is an example of an IntelliMagic Vision balance chart.
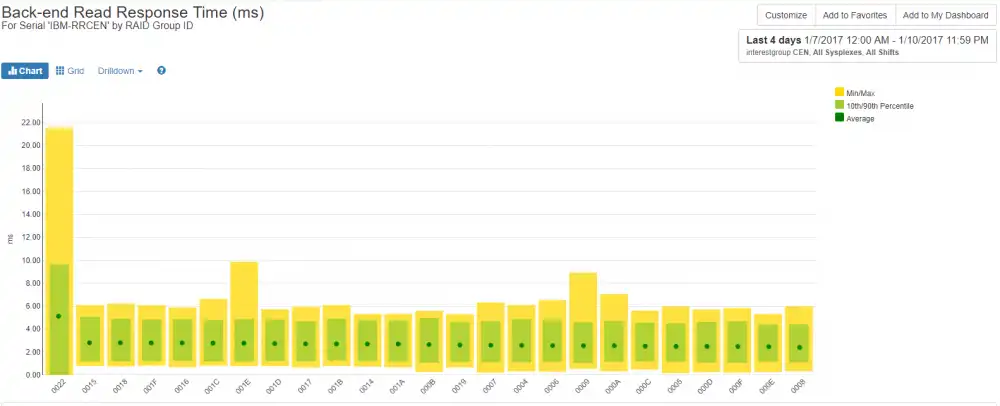
The image above shows that one RAID array in this storage pool is imbalanced in terms of read response time. This could indicate a physical problem with a disk drive in the array or, more likely, that this RAID array is overloaded.
Manage Auto-Tiering
More recently, storage vendors have incorporated solid state storage and auto-tiering into their design. This means that extent pools have become even more complex as they now may consist of multiple tiers of disk or flash storage. Each extent will typically be tied to a particular tier, but a logical volume may include extents that reside on various storage tiers.
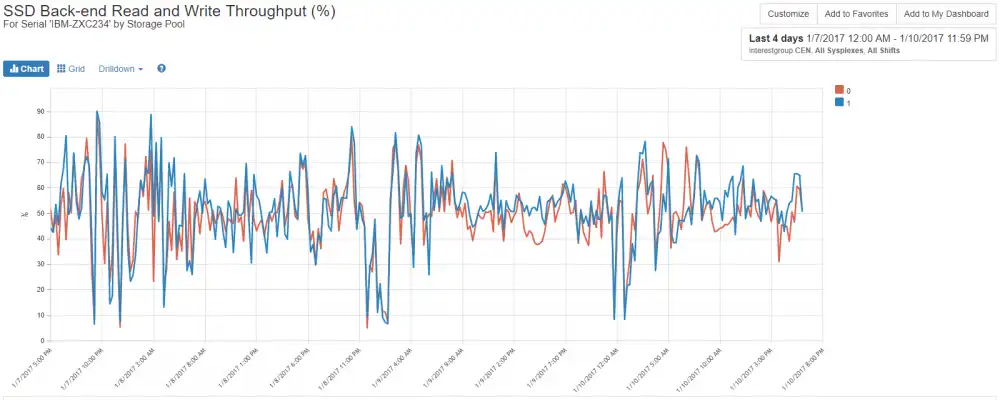
IntelliMagic Vision can give you a view of how logical volumes are using the various storage tiers in an auto-tiering environment. This can help you assure that your flash capacity is being used as effectively as possible.
The chart below illustrates how IntelliMagic Vision can tell you how much volume activity is distributed to the flash devices on a storage system.
Understand how logical workloads behave on physical hardware
IntelliMagic Vision for z/OS Disk provides the Intelligence needed to understand how logical workloads behave and are distributed across your physical hardware. Without this capability, the relationship remains opaque and will be a mystery that could cause pain in your daily operations.
Learn more or start a free trial here.
Using IntelliMagic Vision for TS7700 Performance Analysis
IntelliMagic Vision for TS7700 automatically compares the hardware views (via BVIR data) with the workload metrics, providing you with insight into how the standalone or gridded hardware is handling the work and replication between boxes.
This article's author
 Lee LaFrese
 Share this blog
Related Resources
What’s New with IBM DS8900F?
Release 9.1 for the DS8900F storage array contains numerous product improvements that should be interesting and useful to any shop that has DS8900F installed or is considering it.
How an Unexpected Drop in Response Time Led to a Quick Permanent Replication Improvement
Learn how a recent unexpected drop in asynchronous response time led to the discovery that one of the network links used for asynchronous replication went down and a permanent performance improvement.
IntelliMagic Vision Support for Hitachi VSP SMF Records from Mainframe Analytics Recorder
Learn how to gain insight into the health of the Hitachi Virtual Storage Platforms VSP 5000 series and VSP F/G1x00 storage systems using the SMF records created by the Hitachi Mainframe Analytics Recorder.
Book a Demo or Connect With an Expert
Discuss your technical or sales-related questions with our mainframe experts today