
I’ve been riding a motorcycle for a long time. Back when I first started riding, the gas gauge was the reserve tank. Music consisted of listening to the roar of the tail pipes. A kick starter was used. Nowadays there is a gas gauge, low fuel message, remaining miles indicator and when critical, a map displays automatically to lead to the nearest gas station. Music is a 4 speaker boombox. The kick starter has been replaced with a start button.
Like motorcycles, computers have come a long way. From no performance or capacity reporting, to manual reporting, to pre-built AIOps based reports.
Tape grids, like a motorcycle running out of gas, are running fine one minute and the next minute their jobs can be delayed or fail. Data replicating to the DR site is normal, but then a problem causes a backlog and high deferred queue age.
There are many gas-gauge-like indicators for tape grids, but reviewing them daily can be time consuming especially for configurations with many clusters and grids. Rather than reviewing every indicator across your entire tape grid, there are 6 key reports that you should be reviewing regularly to keep your TS7700 in good working order, and give back time in your busy day.
Report 1: Channel Throughput
The are many reasons a TS7700 can cause host jobs to run slowly. Host configured maximum throughput, spikes in workloads, sync copy and remote writes, all of these may cause delays. Showing a week or two weeks of data can show if peaks occur at regular intervals as it does in this report.
Some solutions, such as IntelliMagic Vision, allow you to drill down by day of week to easily show which day and time the peaks occur. And you can set warnings and exceptions to alert you when thresholds are reached such as when to add host adapters or when the host configured maximum throughput limit is exceeded.
Figure 1 below shows the total amount of host throughput by grid. These grids do not exceed warning thresholds and appear to be not have any host problems, but workload allocation is spread between both grids so the throughputs for each grid should be roughly the same.
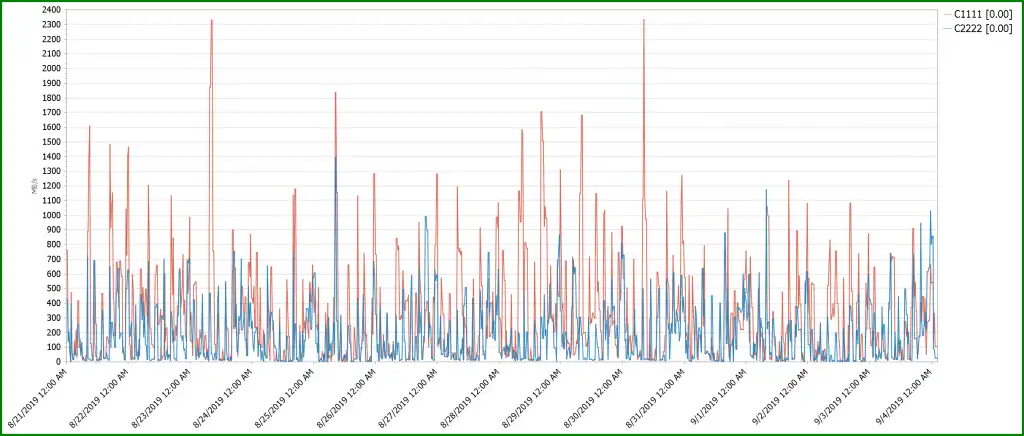
Figure 1: Grid level FE Channel Write Throughput
The following balance chart highlights this.
Report 2: Balance Charts
Balance charts are very useful at showing workload distribution amongst grids, clusters, host adapter ports and many other components of the tape environment. Figure 2 shows that the two grids do indeed have very different concurrent virtual devices mounted. Virtual device allocation between grids is controlled by z/OS, so root cause analysis must continue there.
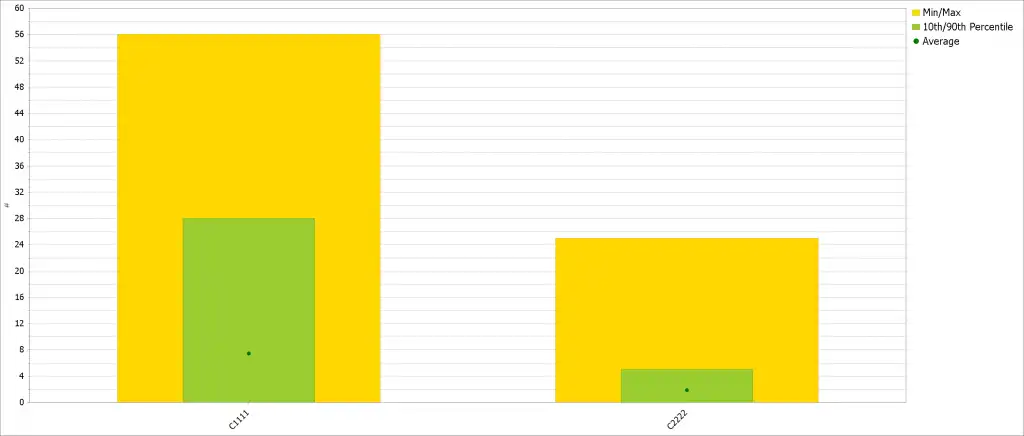
Figure 2: Average Virtual Devices Mounted
Report 3: Cache Flows Reporting
Determining the cause of delays can be difficult and time consuming. Many data movements occur concurrently within a TS7700. The Cache Flows report shows the data movements contributing within the TS7700. Figure 3 shows how easy it is to follow the flow of data within a cluster.
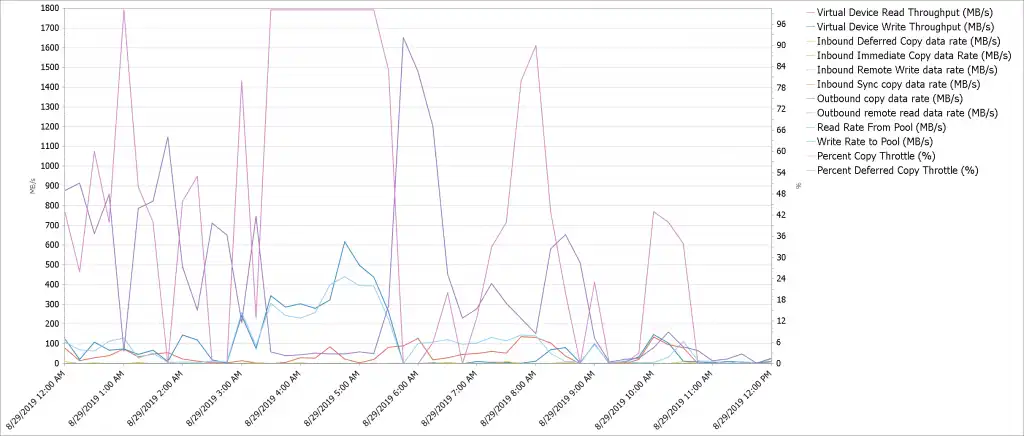
Figure 3: All data flows in and out of Cache with Throttling percentages on secondary axis
The Percent Copy Throttle and Percent Deferred Copy Throttle have been added to the secondary axis of the Cache Flows chart to show how throttling affects copy operations.
Figure 3 shows that as Virtual Device Write Throughput exceeds 100 MB/sec, the Deferred Copy Throttle increases and delays the outbound copy data or replication when reaching 100%. The throttling continues until Device Write Throughput decreases to 100 MB/sec and the Percent Deferred Copy Throttle goes to zero allowing the outbound copy data rate to increase replicating the logical volumes.
Additionally, when this cluster has replication backlog or high deferred queue age and all MB/s rates are zero for an extended period of time then the cluster should be reviewed to determine that it is still operational.
Report 4: Cache Utilization
Many grids are either tapeless or have clusters with cache buffers large enough to contain all logical volumes. Figure 4 below displays the disk cache utilization percentage for these clusters.
If the configuration is tapeless, then knowing how full the disk cache is important. If the disk cache reaches a user specified alert percentage of the total cache space the TS7700 issues a critical message to host attached zOS systems.
Even when cache utilization % is good, the workload can be unevenly balanced such that all clusters or grids are not filling at the same rate. Adjustments to workload balancing can easily be made before utilization reaches a critical point; it is more difficult to move workloads from one grid to another.
Charting utilization over long periods of time shows growth rates and with enough data predicting when more disk cache is needed or when appropriate actions need to be taken.
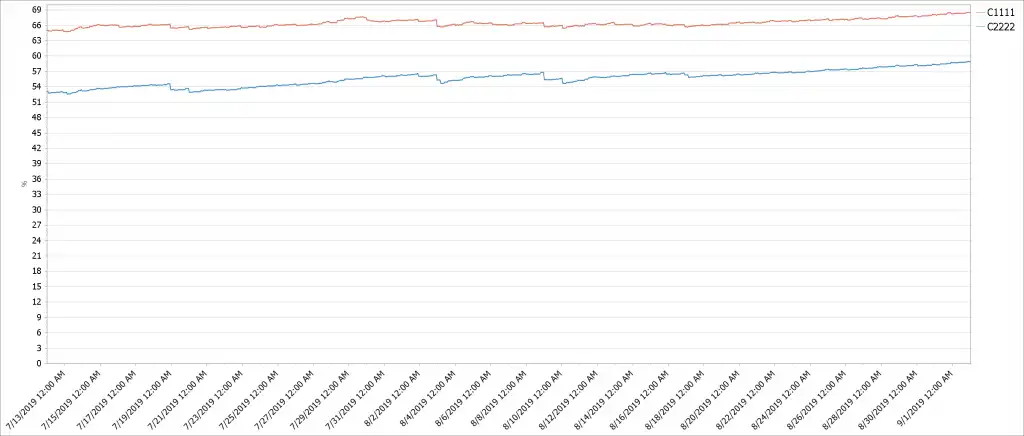
Figure 4: Unbalanced workloads causing one grid’s cache to fill before the other.
Report 5: Average Deferred Queue Age
This report shows the RPO for virtual tape volumes. Thresholds should be configured to alert when RPO is exceeding target values for replication of data to a local cluster or a DR site.
Figure 5 below shows the exception threshold being exceeded as indicated by the red border and the bolded display in the table key. There are many reasons that the threshold was exceeded, including network performance, Deferred Copy Throttle, an increase in the workload, or the cluster may not be able to receive data, either because its cache is full, or it is nonfunctional. Report #3, Cache Flows report, or Report #6, Replication Overview, can be used to verify most of these.
Figure 5 below shows clusters which normally experience a few minutes of RPO, then at about 11PM on 8/29 Deferred Queue Age starts to increase and has spikes of over 30 minutes. A status display of the GRIDLINKs was needed to determine the high retransmission percentage and loss of an active link causing the high Deferred Queue Age.
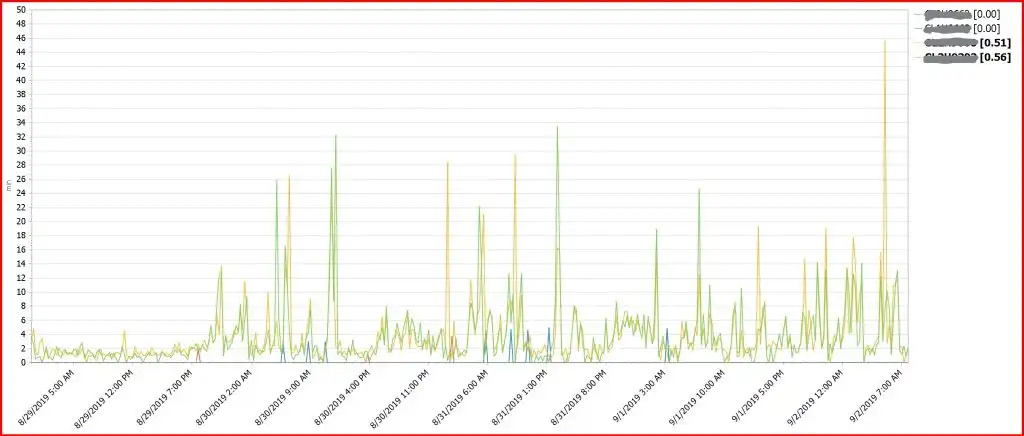
Figure 5: Average Deferred Queue Age shows the clusters RPO
Report 6: TS7700 Replication Overview
This multi-chart report shows important information about the health of grid replication.
Replication Backlog, Average Deferred Queue Age and Average Immediate Queue Age indicate if replicated data is not meeting RPO requirements. If these are all in the green, then replication is normal. If replication is exceeding thresholds, Average Deferred Copy Throttle, Outbound Copy Data Rate and Inbound Total Copy Data Rate may indicate what the problem is.
In Figure 6, Average Deferred Queue Age (the middle report in red) is below the threshold and then starts to exceed the threshold and continues exceeding. The Inbound and Outbound copy data rates do not change and appear to be OK, but because replication is grid level, all clusters sending and receiving data must be reviewed and analyzed.
Other clusters were found to have much high copy data rates and it was found that a network issued caused the problem.
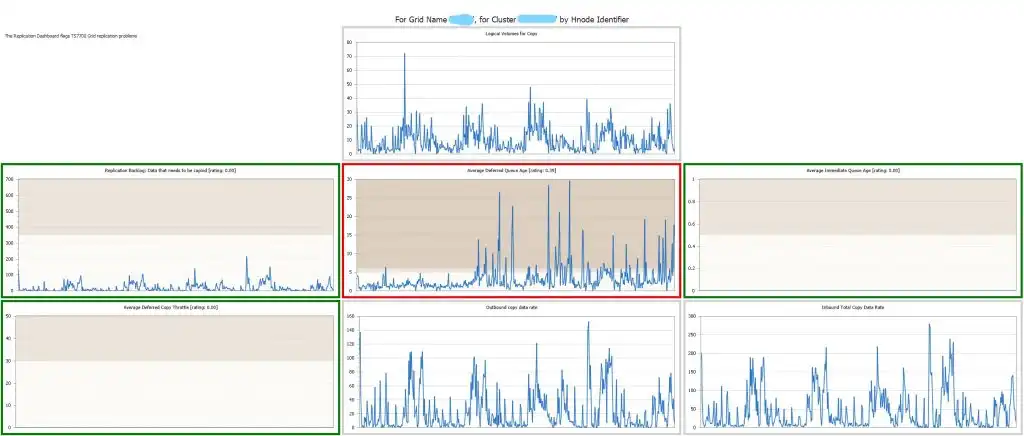
Figure 6: Replication Multi-chart provide a wealth of data all in one report_LI
The 6 Most Important Reports for Your TS7700 Performance Health
Like motorcycle upgrades and enhancements over the years, computer monitoring has advanced such that z/OS performance management solutions such as IntelliMagic Vision now use AI to analyze thousands of metrics to intelligently report to users that something is amiss.
This intelligent reporting allows you to review these 6 crucially important TS7700 reports without any coding necessary:
- Channel Throughput
- Balance Charts
- Cache Flows Reporting
- Cache Utilization
- Average Deferred Queue Age
- TS7700 Replication Overview
And more than just eliminating coding, by utilizing an AI-based design with z/OS-specific knowledge, reports come pre-analyzed to allow the human analyst the ability to see the overall health in an instant, and drill down the root cause.
Regardless of your current performance management solution, keeping an eye on these 6 reports is crucial to maintaining and optimizing your TS7700 performance health.
Using IntelliMagic Vision for TS7700 Performance Analysis
IntelliMagic Vision for TS7700 automatically compares the hardware views (via BVIR data) with the workload metrics, providing you with insight into how the standalone or gridded hardware is handling the work and replication between boxes.
This article's author
 Merle Sadler
 Share this blog
Related Resources
Challenging the Skills Gap – The Next Generation Mainframers | IntelliMagic zAcademy
Hear from these young mainframe professionals on why they chose this career path and why they reject the notion that mainframes are obsolete.
New to z/OS Performance? 10 Ways to Help Maintain Performance and Cost | IntelliMagic zAcademy
This webinar will delve into strategies for managing z/OS performance and costs. You'll gain insights into key metrics, learn how to identify bottlenecks, and discover tips for reducing costs.
What's New with IntelliMagic Vision for z/OS? 2024.2
February 26, 2024 | This month we've introduced changes to the presentation of Db2, CICS, and MQ variables from rates to counts, updates to Key Processor Configuration, and the inclusion of new report sets for CICS Transaction Event Counts.
Book a Demo or Connect With an Expert
Discuss your technical or sales-related questions with our mainframe experts today