
When performance analysis often focuses on response time increases, why should I care about a response time drop? Capacity-driven-analysis tells us when we run out of CPU, memory, disk, and more. Another primary focus on increases looks for stress in the environment. These tendencies drive our work toward chasing the peaks, so when a response time drops, is there something wrong? Of course, that’s a loaded question, and the standard answer might be true but unsatisfactory. “It depends” is often an easy and empty response that may dismiss an opportunity for improvement.
In this blog, I’ll detail a recent case where an unexpected drop in asynchronous send response time led to the discovery that one of the network links used for asynchronous replication went down, and how the resulting change led to a performance improvement.
Response Time Dropped, So Why Should I Report it?
After years of reviewing performance data across many different systems, it would be easy to ignore something that is “healthy” and move on. There are usually hundreds of other tasks urgently waiting to capture my attention. Fortunately, my current position affords me opportunities to add value by quickly highlighting something that changed significantly even though it may appear to be fine.
During one of the daily health assessments I perform for customers, I observed a drop in asynchronous response time that caught my attention. Using easy visualization of the data, it took less than 5 minutes to document and share the report (seen in Figure 1) showing the asynchronous response time drop with the customer.
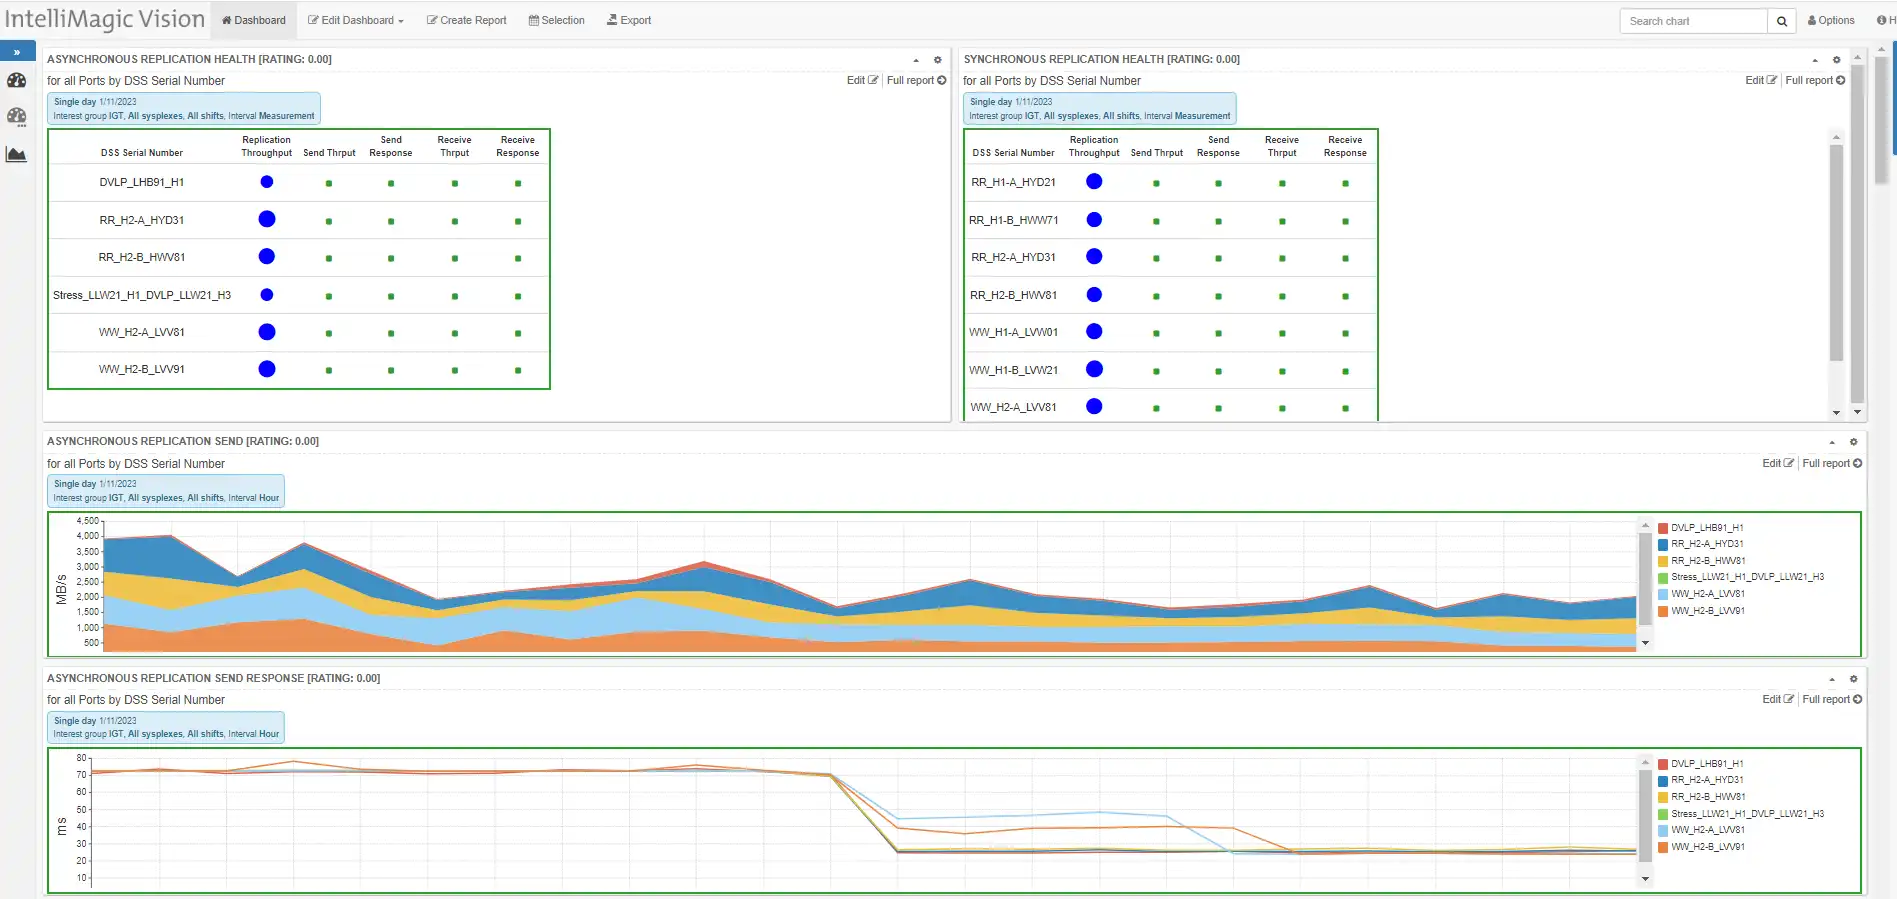 Figure 1: Customized Disk Performance Dashboard in IntelliMagic Vision Used for Customer Daily Reviews
The snapshot of the Disk Performance Dashboard above shows no stress. All is well with the Asynchronous and Synchronous replication. All the ratings and metrics are green with no warnings for throughput, or response times. There’s nothing to see here, move along, right? Wait a minute. Why did the Asynchronous response time drop (bottom report in Figure 1)?
Visually, the drop looked significant, but without looking at the historical data, I couldn’t automatically determine if the change was unusual or not. Thankfully, there’s statistics.
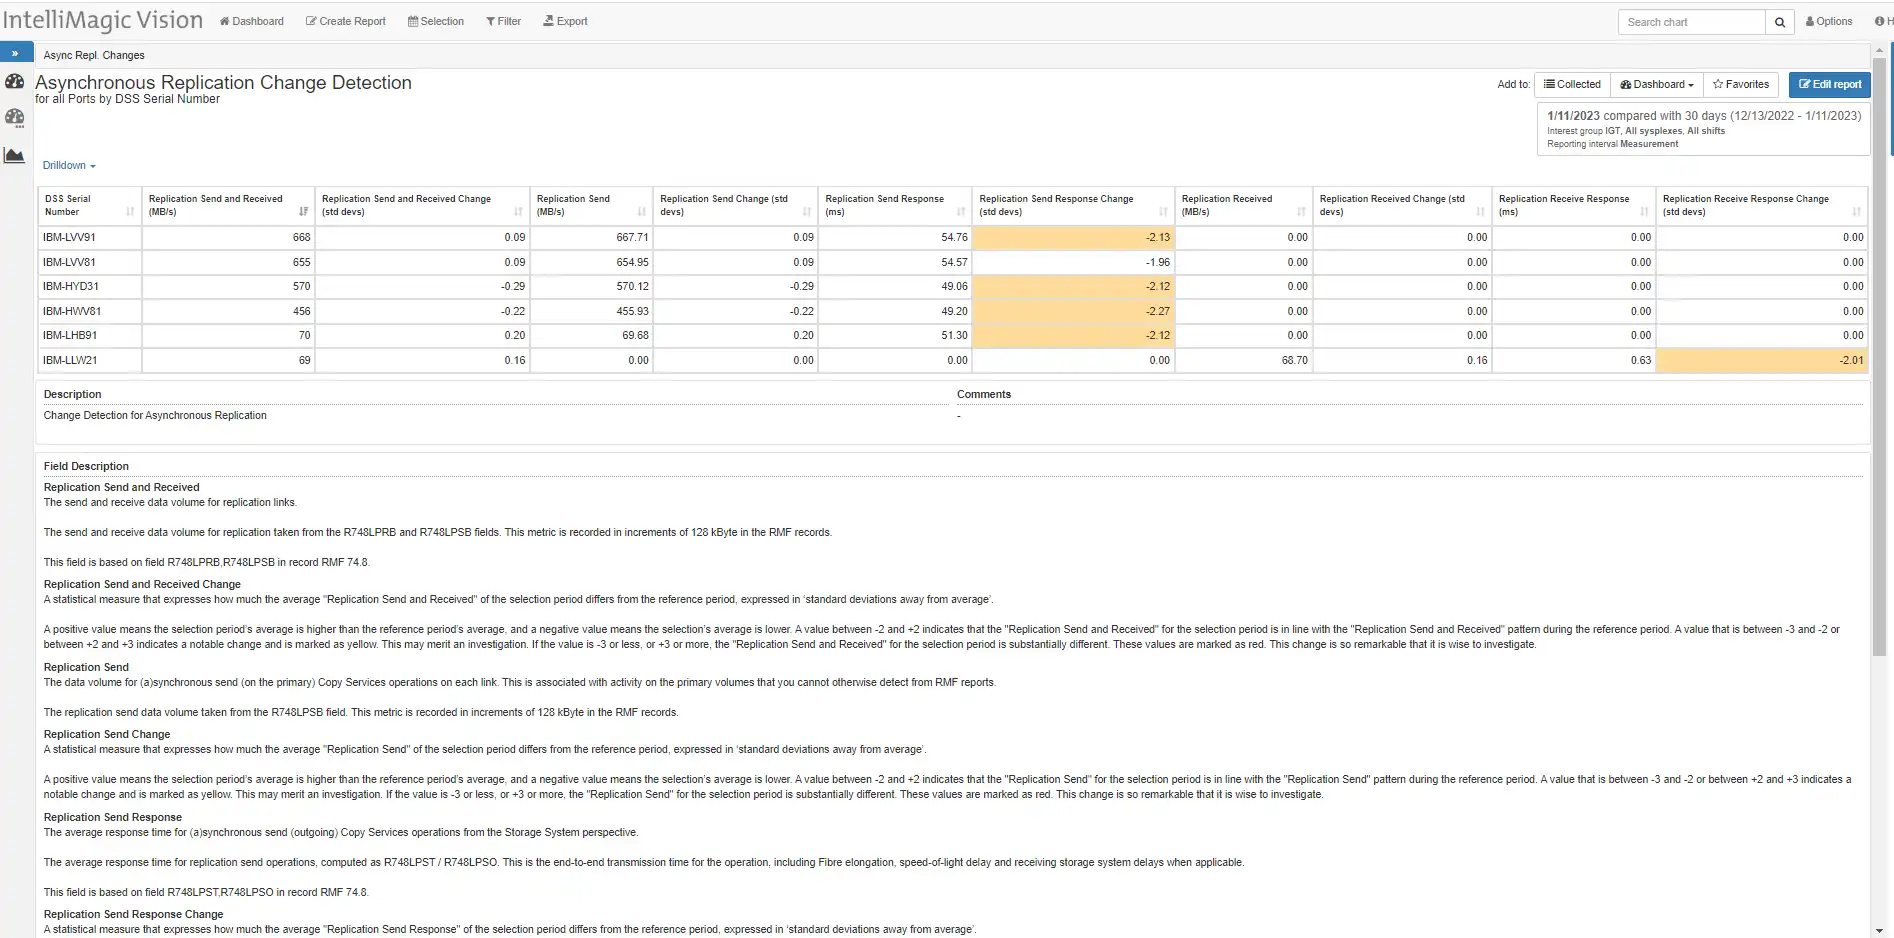 Figure 2: Asynchronous Replication Change Detection
Figure 2 shows an Automatic Change Detection Report for Asynchronous Replication. Change Detection reports automatically highlight statistically relevant ‘changes’ in metrics – useful for identifying dramatic changes in behavior (response time) that may be manifested with a configuration change. Quickly examining this Change Detection report easily confirmed the ‘drop’ from Figure 1.
The drop in response time actually improved stability and removed a throughput bottleneck that was creating some occasional increases in RPO.
Please note that ‘std devs’ (number of standard deviations), also known as the z-score, can be positive or negative so that drops are noticed just as effectively as jumps.
What Happened?
Although the response time drop normally might have been glanced over, after quickly confirming that it was a significant change from the norm, I shared the reports and information with the customer. Initially, they were unaware of any reason for the change. After making some calls with their network infrastructure folks, the customer learned that one of their network providers had some issues, and one of the network links used for asynchronous replication had gone down.
Best practice for asynchronous replication configures network links across at least 2 independent network paths so that if a network outage or congestion interrupts traffic on one circuit, the data replication can continue on a path unlikely affected by issues on other circuits. While this is best practice, the challenge in maintaining latency consistency between geographically dispersed links is not possible simply due to the physics of the speed of light and link distance differences.
Improved Productivity
The story here is one of productivity. You can’t add more hours to your day without sacrificing something. It turns out that the customer was already in conversations with their disk vendor on some periods of higher RPO for their asynchronous replication and what steps to take so that their service level expectations were met for their data replication (RPO).
Awareness of this unplanned change helped the customer confirm a change recommended by the disk vendor to exclude the ‘slower’ link from the normal configuration and only use the slower link when necessary (when there was an issue with the primary circuit). This required some changes to the planned configuration, but knowing the resulting performance improvement (observed in production data) of a recommended change helped avoid the effort of planning for the change, filling out the forms for change control, documenting the change, and capturing the reports for the result.
All of the work to ‘test’ the proposed disk vendor solution is done and proven. In addition, knowing the effective improvement for the RPO issue that the customer was encountering provided additional incentive to make the changes in production sooner so that those annoying ‘emails’ stop telling them that the RPO is being exceeded.
Productivity and Resilience
Time is a resource that we are all limited by. Productivity can make better use of the time limits we are constrained by. Having an ability to quickly interact with data enables you to see things that change but may not initially seem important. This case demonstrates that we shouldn’t always ignore changes that show improvement in a particular metric (most often downward).
It’s also important to communicate changes when you see them. The phrase, “If you see something, say something”, comes to mind. If you have to write a program to show the results of what you saw, it’s not likely going to happen when you’ve already got too much to do in a day. However, if your reporting solution is adaptable and provides easy collaboration, like putting a link in an email and sending it off to the network guys, you may save yourself some time for something that didn’t seem like it was a big deal.
Ask your CIO if missed RPO’s is a big deal. It might not be popular, but it is rather important. There are many other instances where looking at a drop is important. I’ll cover more of those cases in my next blog. If you would like more ideas from IntelliMagic to help you become more productive, please reach out. That is what we love to do!
This article's author
 Jack Opgenorth
 Share this blog
You May Also Be Interested In:
What’s New with IBM DS8900F?
Release 9.1 for the DS8900F storage array contains numerous product improvements that should be interesting and useful to any shop that has DS8900F installed or is considering it.
IntelliMagic Vision Support for Hitachi VSP SMF Records from Mainframe Analytics Recorder
Learn how to gain insight into the health of the Hitachi Virtual Storage Platforms VSP 5000 series and VSP F/G1x00 storage systems using the SMF records created by the Hitachi Mainframe Analytics Recorder.
From Taped Walls to Your PC: z/OS Configuration Made Simple with Topology | IntelliMagic zAcademy
In this webinar, we explore a technique that integrates diverse data sources from z/OS, presenting them in a clear, concise, and interactive visual format.
Book a Demo or Connect With an Expert
Discuss your technical or sales-related questions with our mainframe experts today