Monitor IBM z/OS Encryption Readiness Technology and Traffic Patterns with IntelliMagic Vision
TCP/IP is the core of communication for z/OS mainframes, both for traffic in and out of the mainframe and internally among z/OS images and processor complexes. Proper management is necessary to secure and protect system availability.
Proactively find security risks and failures before they impact users.

Enhance Mainframe Network Security and Performance with Built-In Health Insights

Proactively Mitigate Security Risks
Utilize advanced AI-based insights and analysis to proactively detect and mitigate unknown z/OS IP traffic encryption security risks.
Improve Network Configuration and Health
Apply built-in health insights and artificial intelligence to highlight configuration and performance issues and quickly resolve them.

Expedite Learning and Enhance Domain Expertise
Detailed built-in explanations, guided drilldown options, and end-to-end z/OS support facilitates easy system understanding and knowledge transfer.
Built-In Intelligence at Your Fingertips
Monitor OSA Channels and HiperSockets
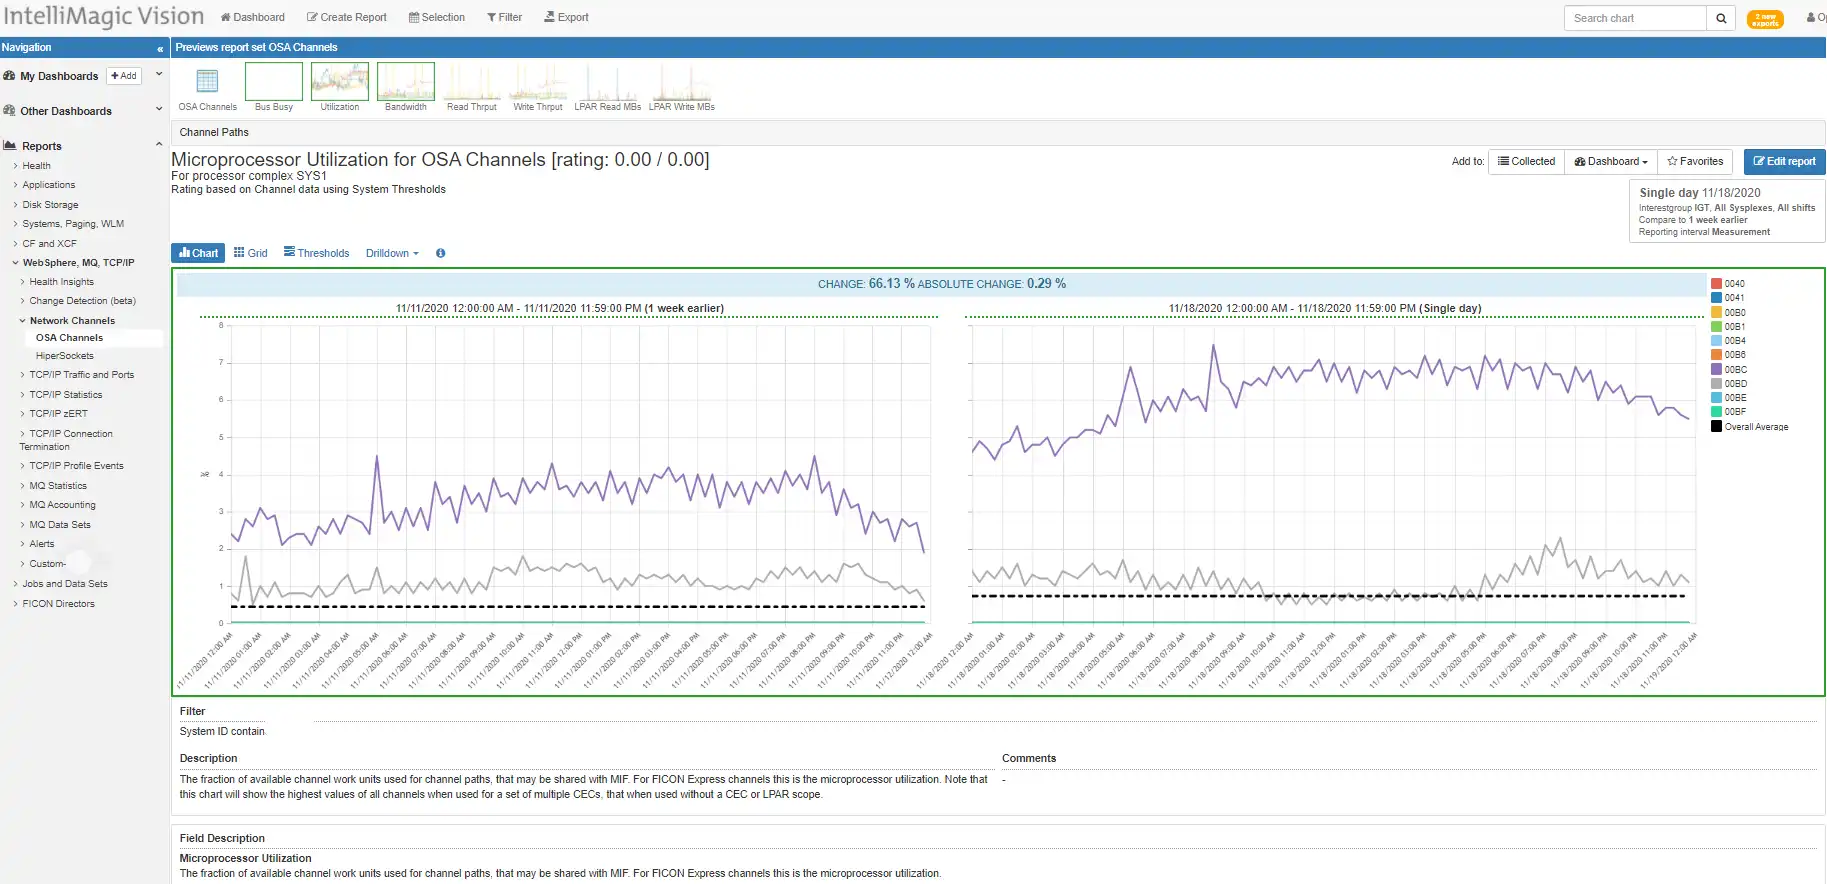
IntelliMagic Vision provides insight into physical interfaces, including OSA channels and HiperSockets that are used for communication between LPARs. While the increase in utilization in this example isn’t a problem for availability (green), the change observed may warrant further investigation and could be related to unnecessary increases in other areas of the infrastructure.
Improve Network Configuration and Health
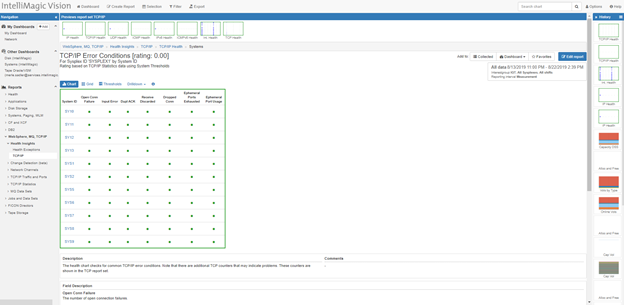
Duplicate Acks may indicate data center and/or external network configuration improvement opportunities. This is one of many metrics which are automatically rated and tracked to provide quick insights into mainframe network health.
DevOps Enablement
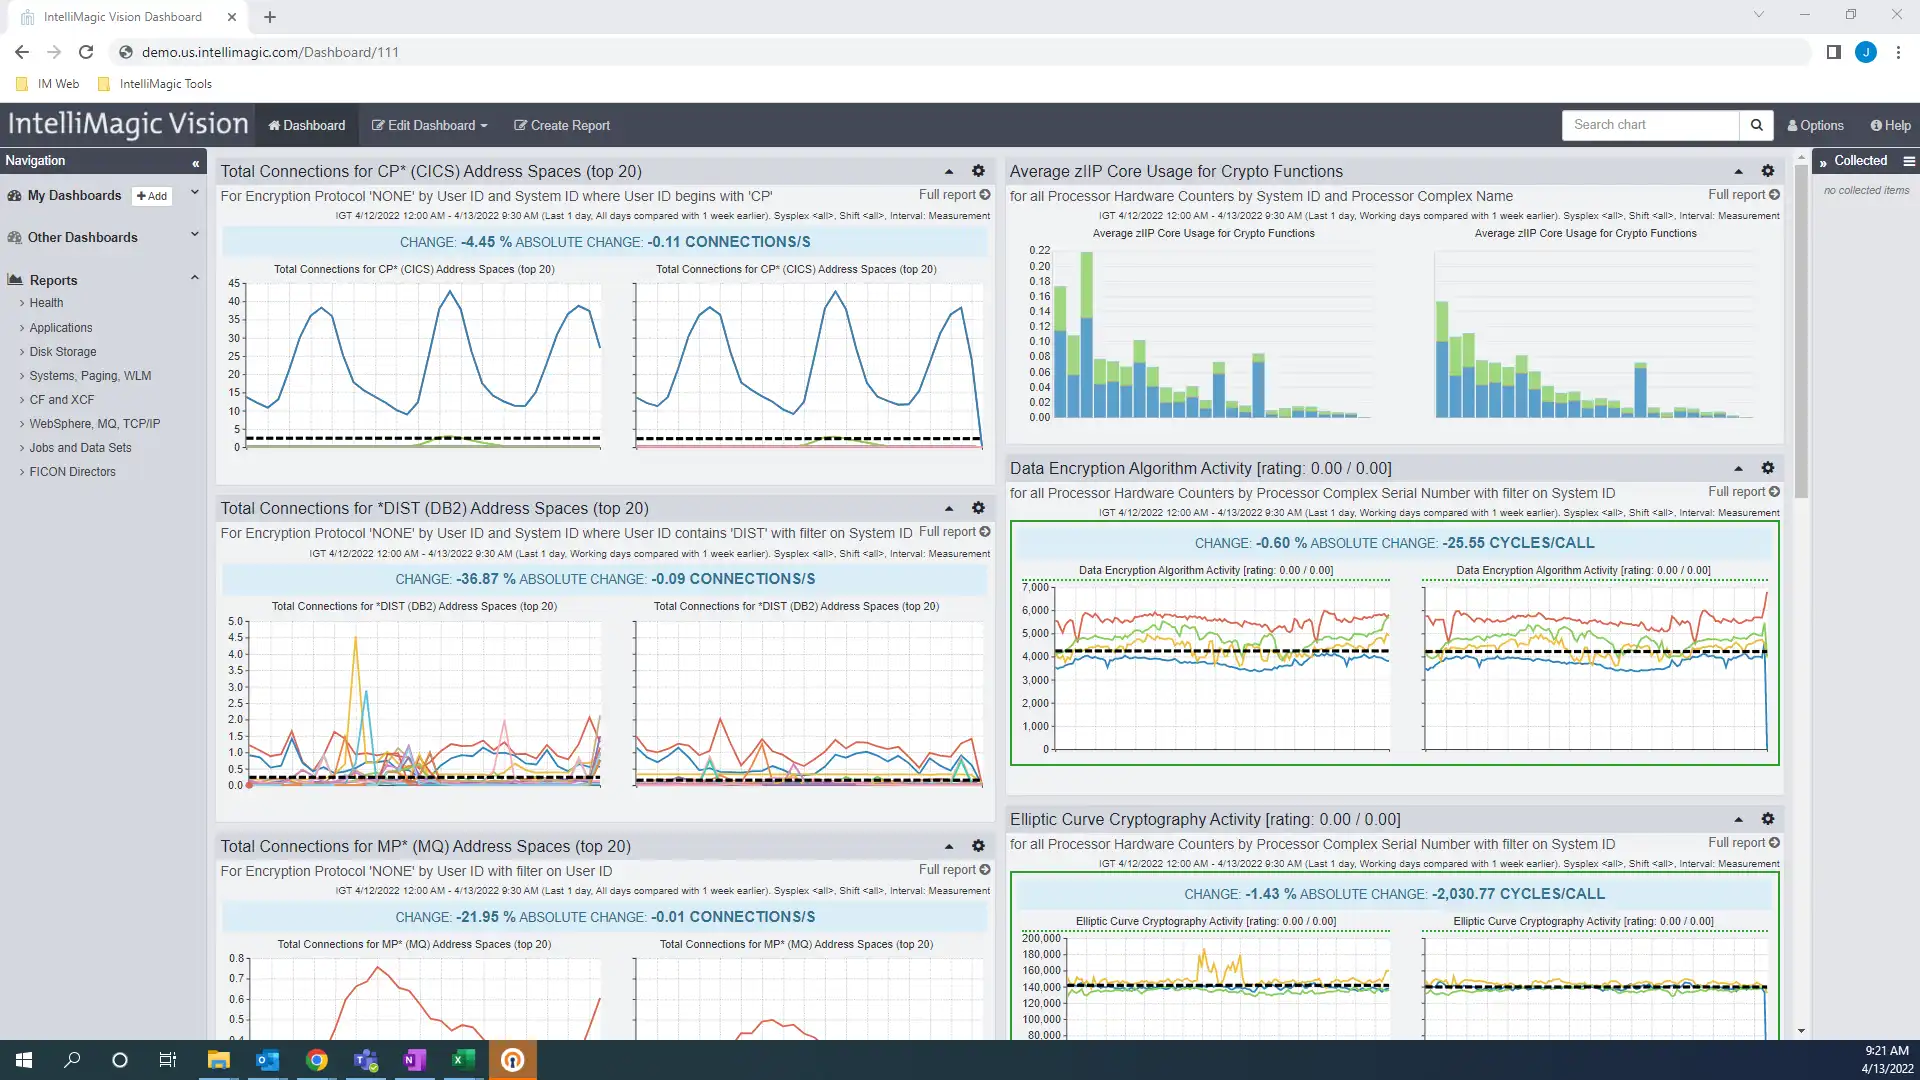
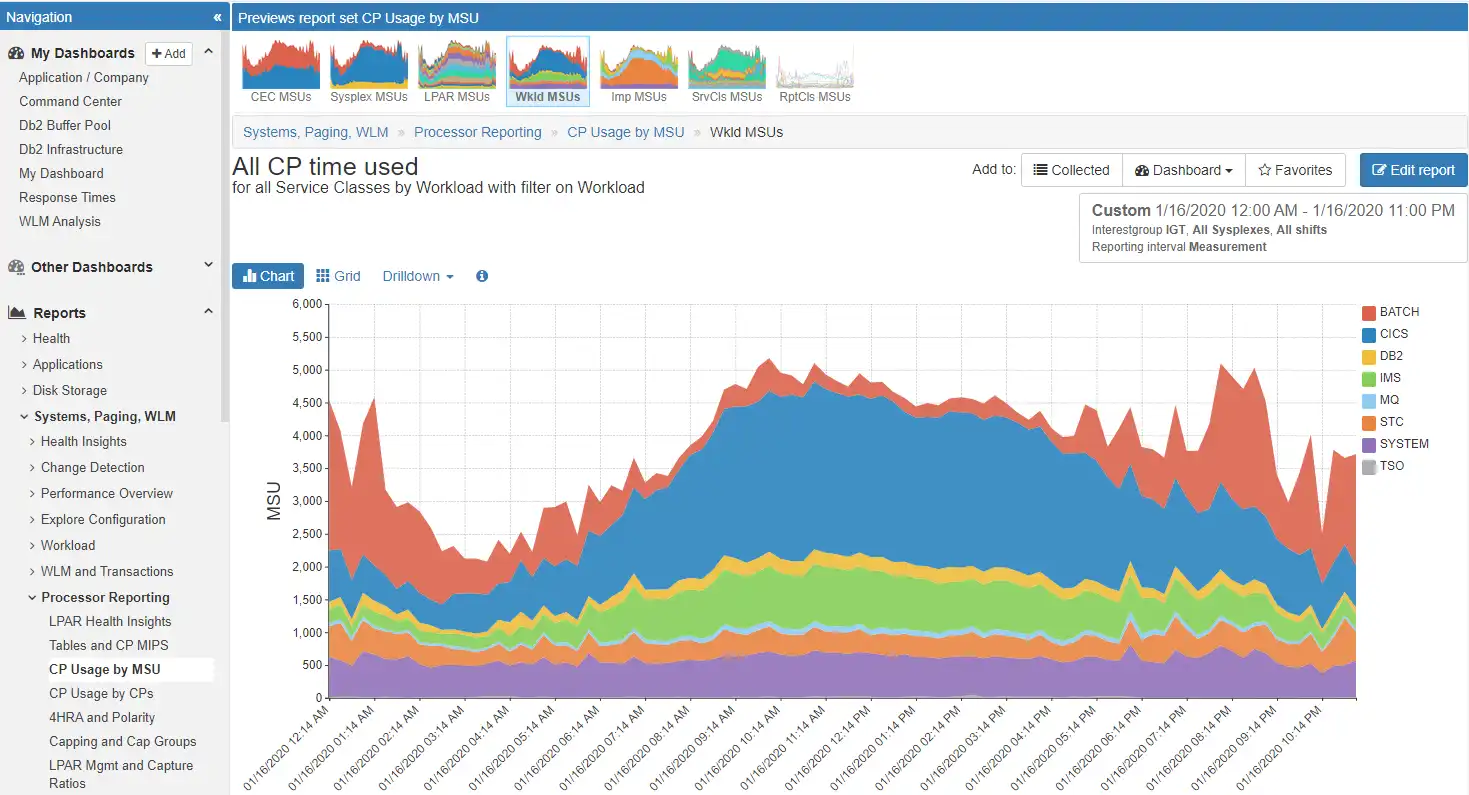
Dashboards of seemingly unrelated metrics can quickly be assembled and shared. One view for performance, network, storage, MQ, CICS, and DB2 to enable collaboration across the enterprise. For instance, this example incorporates type 30 address space consumption, TCP/IP traffic rates, including traffic by Encryption Cipher type. Specific visibility into client and server IP address are also available.
Easily Identify Unprotected (Cryptographically) Traffic
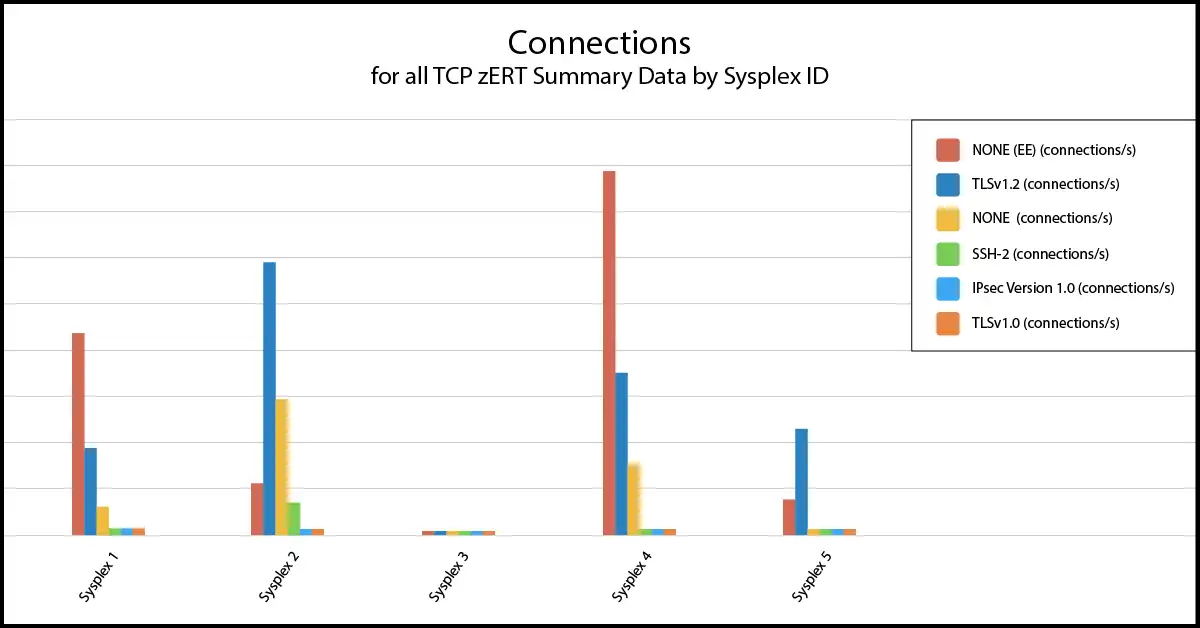
Top-level views (by sysplex as here or by traffic class) provide immediate visibility into the amount of network traffic utilizing each protocol, and perhaps most importantly, identify traffic that is not cryptographically protected.
From here you can drill down by many criteria, including by user ID or server or client IP address, to quickly focus your analysis and identify the details required to determine the source or target of the traffic.
Categorize “traffic classes” based on IP address ranges
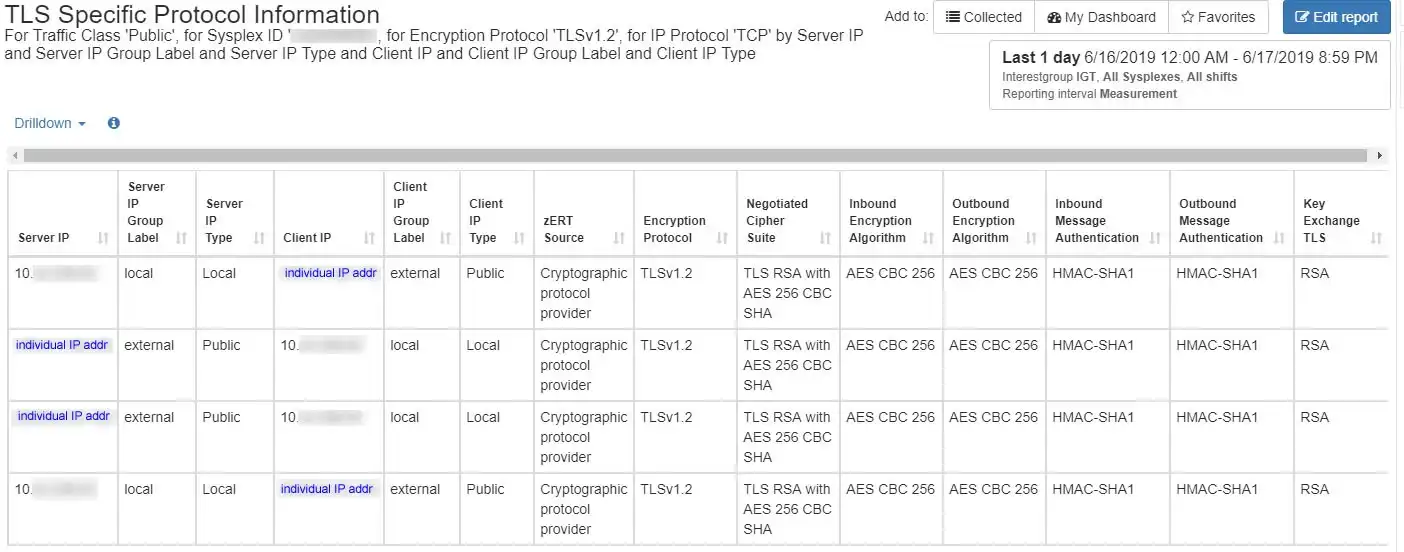
Navigate easily to the subset of network traffic where you want to focus (e.g., by traffic class, IP address, etc.), and have immediate visibility into data specific to the selected protocol.
In this TLS example, that includes encryption algorithms being used, length of the cryptographic keys, and other important attributes of the cryptographic protection.
Average CP Core Usage for Crypto Functions

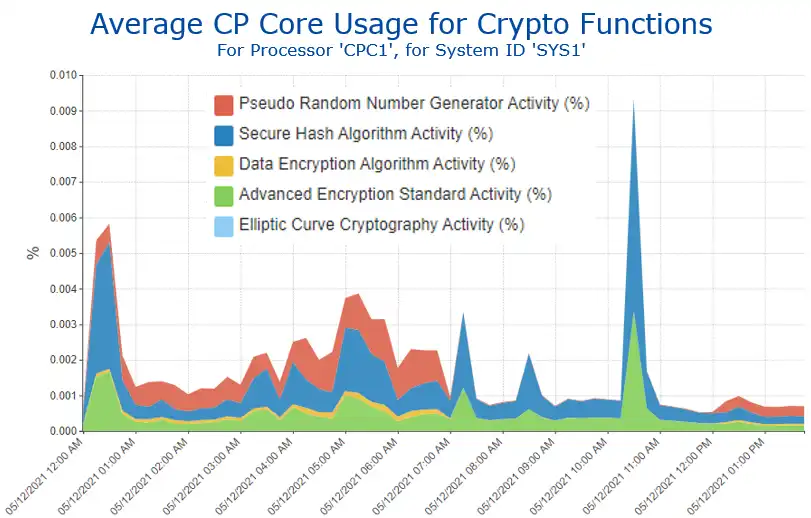
Since the CPU required for encryption can be significant and can vary widely between various encryption types, visibility into CPU is vital.
Before and after analysis of implementation changes enables correlation between the encryption and the business cost (in terms of CPU).
Intuitive Visibility into SMF Data
In contrast to approaches today that require coding programs or mastering tooling siloed by technology to access various types of SMF data, a common, intuitive user interface eliminates effort spent mining data and instead frees up staff to focus entirely on high-value analysis.
This single interface used across the entire z/OS platform greatly expedites learning, promotes collaboration, and enhances analytical effectiveness.
Context Sensitive Drill Downs
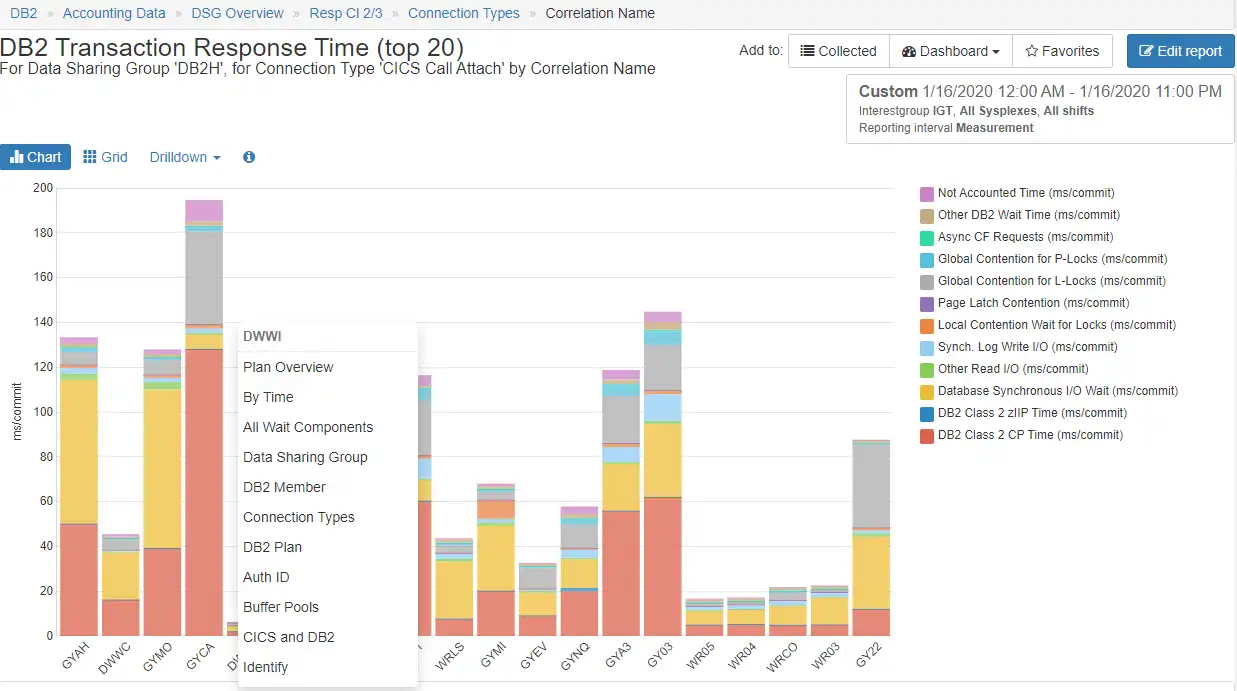
Context sensitive drill downs enable an analyst to identify alternative analytical paths based on the data currently being displayed and quickly investigate each hypothesis with just a few clicks, greatly reducing lost time when exploring what ends up being a “dead-end” path.
When dealing with massive SMF data volumes, this capability to focus analysis on the desired subset of data becomes especially valuable.
Accelerated Root Cause Analysis
Highly flexible drill-down capabilities of IntelliMagic Vision enable data to be viewed at the processor, system, card, or address space level and specific migration activity. Built-in conditional filters can further be a customized for a set of reports on a focused dashboard.
Quickly investigate each hypothesis with just a few clicks and greatly reducing lost time when exploring “dead-end” paths.
AIOps via SaaS Delivery

Advantages to adopting a cloud model include rapid implementation (no lead time to install and setup the product locally), minimal setup (only for transmitting SMF data), offloading staff resources required to deal with SMF processing issues or to install product maintenance, and easy access to IntelliMagic consulting services to supplement local skills.
Monitor OSA Channels and HiperSockets
IntelliMagic Vision provides insight into physical interfaces, including OSA channels and HiperSockets that are used for communication between LPARs. While the increase in utilization in this example isn’t a problem for availability (green), the change observed may warrant further investigation and could be related to unnecessary increases in other areas of the infrastructure.
Improve Network Configuration and Health
Duplicate Acks may indicate data center and/or external network configuration improvement opportunities. This is one of many metrics which are automatically rated and tracked to provide quick insights into mainframe network health.
DevOps Enablement
Dashboards of seemingly unrelated metrics can quickly be assembled and shared. One view for performance, network, storage, MQ, CICS, and DB2 to enable collaboration across the enterprise. For instance, this example incorporates type 30 address space consumption, TCP/IP traffic rates, including traffic by Encryption Cipher type. Specific visibility into client and server IP address are also available.
Easily Identify Unprotected (Cryptographically) Traffic
Top-level views (by sysplex as here or by traffic class) provide immediate visibility into the amount of network traffic utilizing each protocol, and perhaps most importantly, identify traffic that is not cryptographically protected.
From here you can drill down by many criteria, including by user ID or server or client IP address, to quickly focus your analysis and identify the details required to determine the source or target of the traffic.
Categorize “traffic classes” based on IP address ranges
Navigate easily to the subset of network traffic where you want to focus (e.g., by traffic class, IP address, etc.), and have immediate visibility into data specific to the selected protocol.
In this TLS example, that includes encryption algorithms being used, length of the cryptographic keys, and other important attributes of the cryptographic protection.
Average CP Core Usage for Crypto Functions
Since the CPU required for encryption can be significant and can vary widely between various encryption types, visibility into CPU is vital.
Before and after analysis of implementation changes enables correlation between the encryption and the business cost (in terms of CPU).
Intuitive Visibility into SMF Data
In contrast to approaches today that require coding programs or mastering tooling siloed by technology to access various types of SMF data, a common, intuitive user interface eliminates effort spent mining data and instead frees up staff to focus entirely on high-value analysis.
This single interface used across the entire z/OS platform greatly expedites learning, promotes collaboration, and enhances analytical effectiveness.
Context Sensitive Drill Downs
Context sensitive drill downs enable an analyst to identify alternative analytical paths based on the data currently being displayed and quickly investigate each hypothesis with just a few clicks, greatly reducing lost time when exploring what ends up being a “dead-end” path.
When dealing with massive SMF data volumes, this capability to focus analysis on the desired subset of data becomes especially valuable.
Accelerated Root Cause Analysis
Highly flexible drill-down capabilities of IntelliMagic Vision enable data to be viewed at the processor, system, card, or address space level and specific migration activity. Built-in conditional filters can further be a customized for a set of reports on a focused dashboard.
Quickly investigate each hypothesis with just a few clicks and greatly reducing lost time when exploring “dead-end” paths.
AIOps via SaaS Delivery
Advantages to adopting a cloud model include rapid implementation (no lead time to install and setup the product locally), minimal setup (only for transmitting SMF data), offloading staff resources required to deal with SMF processing issues or to install product maintenance, and easy access to IntelliMagic consulting services to supplement local skills.
See Why IntelliMagic is Trusted by Some of the World’s Largest Mainframe Sites
Frequently Asked Questions
Does IntelliMagic Vision report on TCPIP address space storage?
Yes, Virtual storage consumption metrics are part of the TCPIP (119) subtype 5 metrics. These metrics can be viewed over time for metrics that include ECSA, and Private storage, and SMC-R storage allocations and maxims.
How many different Ciphers does IntelliMagic Vision report on?
The combinations of negotiated cipher suite, key length, key exchange, Encryption algorithm, authentication combinations are numerous and site dependent. Specific reports can be set up to filter on site specific cipher activity to meet audit and exception reporting requirements so that obsolete and weak ciphers can be proactively mitigated.
Does IntelliMagic Vision report on OSA channels?
Yes, OSA channel utilization is available through SMF type 73 data. There are Network channel reports in both the system and TCPIP report sets for OSA connected channels. There are specific metrics provided for OSA connected channels, as well as, disk, tape, & other peripherals in other report sets.
What TCPIP (SMF 119) subtypes does IntelliMagic Vision report on?
The z/OS Communication Server:IP programmer’s Guide and Reference contains information on many event and interval subtypes (well over 40). IntelliMagic Vision reports on the following subtypes:
2 – TCP termination records, (Event record reported on Intervals)
4 – TCP/IP profile event record (Event record reported on Intervals)
5 – TCP/IP statistics record (Interval)
6 – Interface statistics record (Interval)
7 – Server port statistics record (Interval)
12 – zERT summary record (Interval, Event)
IntelliMagic Vision does not report on SMF 119, subtype 11 (detailed zERT) data.
Does IntelliMagic Vision report on TCPIP address space CPU?
Yes, the TCPIP address space CPU consumption is available within the SMF type 30 reporting from the Address Space level reporting within IntelliMagic Vision.
Does IntelliMagic Vision report on crypto express and crypto-coprocessor activity?
Yes, these metrics are reported on within the systems data since these services and components are used for both network traffic in transport, and in storage (Disk / Tape) operations. These metrics are available in SMF type 70 data, and some of the SMF type 113 records for cryptographic coprocessor statistics.
Are there specific tasks required to activate zERT data collection?
The zERT summary data collection steps are available in the data collection guide, Appendix M. There are commands, and setup needed to correctly gather zERT summary data. Detailed zERT data is very voluminous, and can be care should be taken if analysis requires this type of data.
What types of data are collected in the zERT data?
There are 3 main types of data collected in the zERT SMF record and reported on by IntelliMagic Vision. These help answer the what, who, and how much questions related to security.
How: Protection attributes: the security protocol, protocol version, cryptographic algorithms, key lengths.
Who: Identifying attributes: IP addresses, Ports, Jobname, Userid.
How much: Statistics: Connection counts, Byte counts.
NO secret data (key values or initialization vectors) are collected or reported on.
Book a Demo or Connect With an Expert
Discuss your technical or sales-related questions with our mainframe experts today
End-to-End Infrastructure Analytics for z/OS Performance Management
zSystems Performance Management
Optimize z/OS Mainframe Systems Management with Availability Intelligence
Benefits
Optimize z/OS Systems performance management using AI-driven analytics to proactively monitor and manage your z/OS environment, prevent disruptions, reduce costs, and preserve the reliability and availability that mainframes are known for.
Explore z/OS Systems Performance Analytics
Db2 Performance Management
Prevent Availability Risks and Optimize Db2 Performance
Benefits
The volume and complexity of Db2 Statistics data and Db2 Accounting data creates a major challenge for analysts who want to derive value from the rich metrics available.
Easy visibility into key Db2 metrics through SMF records is crucial to proactively prevent availability risks and to effectively manage and optimize performance.
Explore Db2 Performance Analytics
Easy visibility into key Db2 metrics through SMF records is crucial to proactively prevent availability risks and to effectively manage and optimize performance.
CICS Performance Management
Monitor and Profile CICS Transactions and Regions with IntelliMagic Vision
Benefits
CICS SMF Transaction data is a rich source of performance insights, but its volume can make analysis challenging using traditional approaches that rely on static reports. Proactive assessment of key Statistics metrics across all regions is essential to identify potential risks to availability.
IntelliMagic Vision enables performance analysts to manage and optimize their z/OS CICS transactions more effectively and efficiently, as well as proactively assess the health of their CICS regions.
Explore CICS Performance Analytics
IntelliMagic Vision enables performance analysts to manage and optimize their z/OS CICS transactions more effectively and efficiently, as well as proactively assess the health of their CICS regions.
Virtual Tape Performance Management
Proactively Manage Virtual and Physical Tape Environments
Benefits
With tape virtualization, tape storage became easier and more economical, but at the same time, more difficult to understand which changes or hardware upgrades are the best choices. With tape libraries being shared across multiple z/OS images, the full picture can only be obtained by aggregating workload and tape hardware information from all z/OS LPARs.
IntelliMagic Vision enables performance analysts to manage and optimize their z/OS Virtual Tape environments more effectively and efficiently.
Explore Tape Performance Analytics
IntelliMagic Vision enables performance analysts to manage and optimize their z/OS Virtual Tape environments more effectively and efficiently.
Disk & Replication Performance Management
Automatically Detect Disk Performance Risks & Quickly Resolve Issues
Benefits
As Disk speeds and throughputs have increased, z/OS applications have come to rely on fast and consistent storage performance. To respond quickly to unexpected disk and replication issues, it is essential that you have insight into the health of the various components in your storage environment.
IntelliMagic Vision enables performance analysts to manage and optimize their z/OS Disk and Replication environment more effectively and efficiently.
Explore Disk Performance Analytics
IntelliMagic Vision enables performance analysts to manage and optimize their z/OS Disk and Replication environment more effectively and efficiently.
MQ Performance Management
Optimize and Analyze MQ Activity and Performance
Benefits
MQ is widely used across z/OS environments, but sites often find it challenging to derive the valuable performance insights potentially available from MQ SMF Statistics and Accounting data due to limitations in existing reporting and available tooling.
IntelliMagic Vision enables performance analysts to manage and optimize their z/OS MQ configurations and activity more effectively and efficiently, as well as proactively assess the health of their queue managers.
Explore MQ Performance Analytics
IntelliMagic Vision enables performance analysts to manage and optimize their z/OS MQ configurations and activity more effectively and efficiently, as well as proactively assess the health of their queue managers.
z/OS Network Performance Management
Automatically Monitor Mainframe Network Security and Protect Your Data
Benefits
TCP/IP is the core of the communication for the z/OS mainframe, both for traffic into and out of the mainframe and internal communication among z/OS images and processor complexes. Proper management is necessary to secure and protect system availability.
IntelliMagic Vision automatically generates GUI-based, interactive, IBM best-practice compliant rated reports that proactively identify areas that indicate potential upcoming risk to TCP/IP health, performance, and security.
Explore z/OS Network Performance Analytics
IntelliMagic Vision automatically generates GUI-based, interactive, IBM best-practice compliant rated reports that proactively identify areas that indicate potential upcoming risk to TCP/IP health, performance, and security.
z/OS Connect: Modern Mainframe API Environment
Optimizing Mainframe API Monitoring for Improved Resource Management
Benefits
IntelliMagic Vision enhances mainframe API monitoring and profiling, providing crucial visibility to address issues at the API or service level, ultimately aiding performance analysts in better resource planning and management reporting.
Explore z/OS Connect Analytics
Flexible Deployment and Monitoring

In the Cloud
Cloud based deployment can be accessed from everywhere in the world and is easy to share with colleagues

Services & Support
Take advantage of IntelliMagic's experienced performance experts for standalone custom services or daily monitoring

On Premise
Install the software on premise and use it offline for total control of your installation
Automatically Monitor Mainframe Network Security and Protect Your Data
When managing TCP/IP for z/OS, questions arise such as:
- Performance – Is the workload properly balanced across the available interfaces?
- Network health – Are there errors as a result of physical or logical configuration issues?
- Security – Are encrypted connections always being used as expected?
IntelliMagic Vision automatically generates GUI-based, interactive, IBM best-practice compliant rated reports that proactively identify areas that indicate potential upcoming risk to TCP/IP health, performance, and security. And using the highly flexible drill-down capabilities of IntelliMagic Vision, this data can be analyzed from the address space (socket) level, port number (protocol) level, or physical interface level.
Identify and Remediate Unencrypted Traffic
IBM’s TCP/IP zERT (z/OS Encryption Readiness Technology) positions TCP/IP as the focal point for monitoring reporting on network traffic, including identifying traffic that is not cryptographically protected.
For traffic utilizing recognized protocols (such as TLS, SSH, and IPSec), visibility is provided into protocol specific data, such as which encryption algorithms are used, the length of the cryptographic keys, and other important attributes of the cryptographic protection. This information is valuable for ensuring adherence to corporate security policies as well as substantiating that adherence through required reporting to auditors and compliance officers.
IntelliMagic Vision allows network security administrators to leverage an intuitive, GUI-based web reporter that provides great visibility into data from zERT SMF 119 summary records. It also provides capabilities to categorize network activity into “traffic classes” based on IP address ranges, reflecting the reality that some classes of traffic (e.g., external) are likely to have more stringent encryption requirements than others (e.g., between mainframes within the data center).
IntelliMagic Vision also enhances analysis by translating all of the more than 600 raw codes from zERT records into readable text for cipher suite, encryption algorithms, and message authentication types.
Continue Learning with These Resources
Brochures and Datasheets
Connect With an Expert
Discuss your technical or sales-related questions with our mainframe experts today