
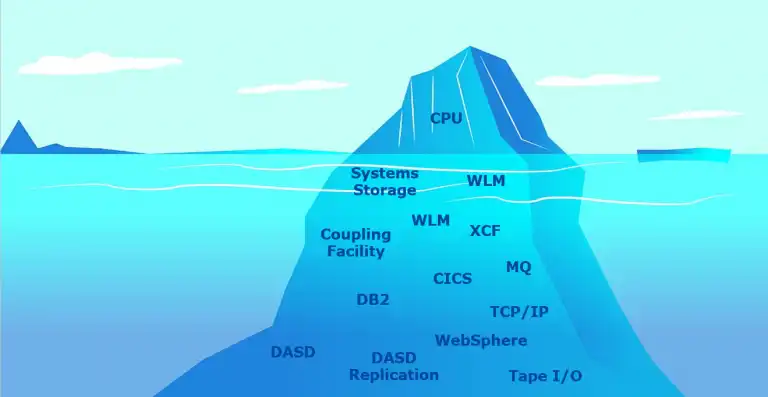
“And that’s just the tip of the iceberg!”
How many times in our lives have we heard that phrase? The ‘tip-of-the-iceberg’ phrase is used to say that there is more to the story, that there is danger ahead, or that the speaker has not researched their discussion point enough. Regardless, we all get it.
In a recent webinar I presented on, “Black Friday in July? Assessing z/OS Infrastructure Performance Readiness”, I discussed some tips and strategies to help prepare for and navigate through a peak season for z/OS shops (such as Black Friday or Cyber Monday).
One of the key points of the webinar was that in order to successfully assess your infrastructure readiness leading up to a peak period, there are numerous equivalently essential metrics that need to be monitored and assessed.
Equivalently Essential Components of the z/OS Infrastructure
When I think about a z/OS system, I think about my evolution as a z/OS Performance and Capacity Planning Analyst. When I first started, CPU utilization was THE metric to watch closely. If you had enough CPU, your system was probably going to be okay when your company hit its predicted peak season.
Going way back, z/OS (or MVS back then) ran batch and not a whole lot else, so companies got used to making CPU the focus when it came to planning.
Now fast forward to our present time. z/OS is responsible for everything from databases, online transactions, network traffic, batch jobs, replicated data, and so much more. The infrastructure to handle this complexity is no longer limited to ensuring CPU is going to be okay. CPU is just the tip of the iceberg.
To keep the z/OS infrastructure running smoothly, even during your busiest periods, it’s the numerous metrics underneath the surface of the water (the ‘equivalently essential’ components) that need to be carefully examined.
Essential Component Example #1: DASD Subsystem
Let me explain with an example. You have done your best to ensure there is enough CPU on the floor to manage your workloads, but you did not update or plan for your DASD subsystem. If peak season rolls around and your CPU is indeed good, but the throughput on your DASD boxes exceeds the capabilities of the machines, your workloads are going to have an issue.
In the following IntelliMagic Vision dashboard, you can quickly see that while most of the higher level DASD metrics are healthy, throughput is being flagged as nearing the limits of the box capabilities.
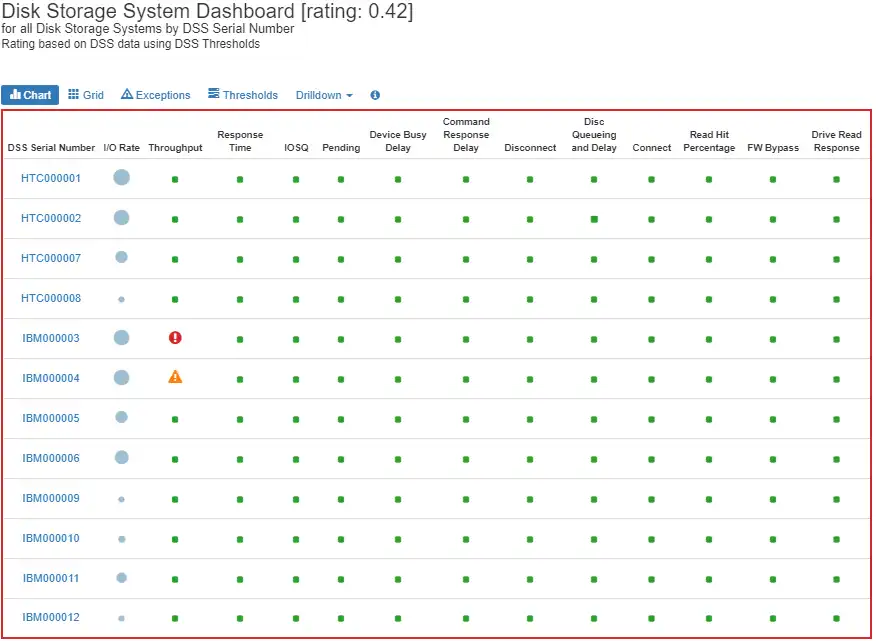
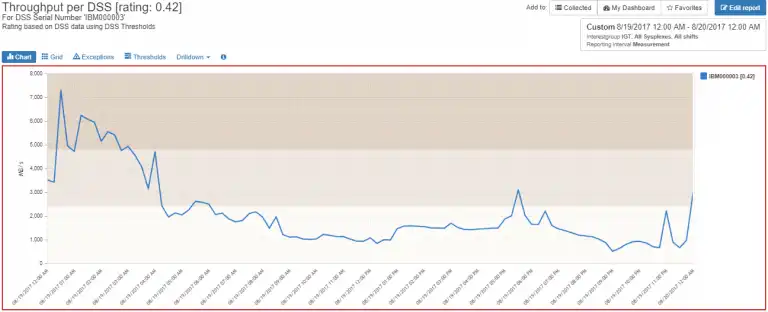
By drilling down, we can look at all of the charts related to the dashboard icons and see which DASD components you can tune before your company’s peak period.
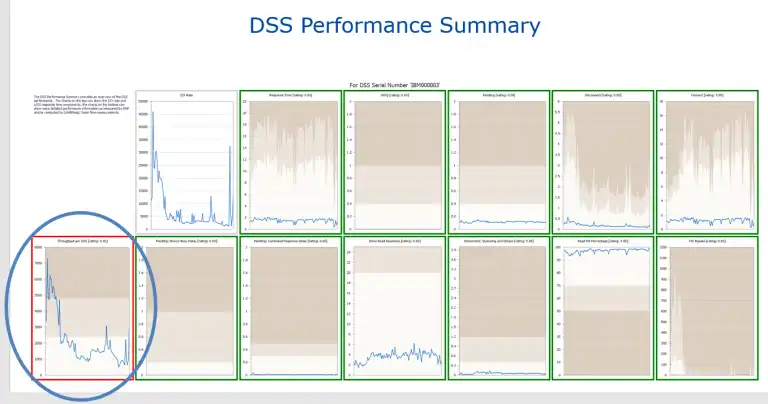
In this case, we clearly need to take a closer look at our Throughput. If we had just been concerned about how much CPU we had, this throughput issue would not have been on our radar.
Essential Component Example #2: Workload Manager Service Policy
I can illustrate with another example. Is your Workload Manager (WLM) Service Policy ready for your upcoming peak season? You might have enough CPU on the floor, but if your workload causes the CPU usage to spike, does your service policy handle the spike as you expect?
The dashboard below shows that a service class or service classes in the importance 1 and importance 2 groups are having issues. This is not what you want to see, especially not during a peak before your company’s busy season.
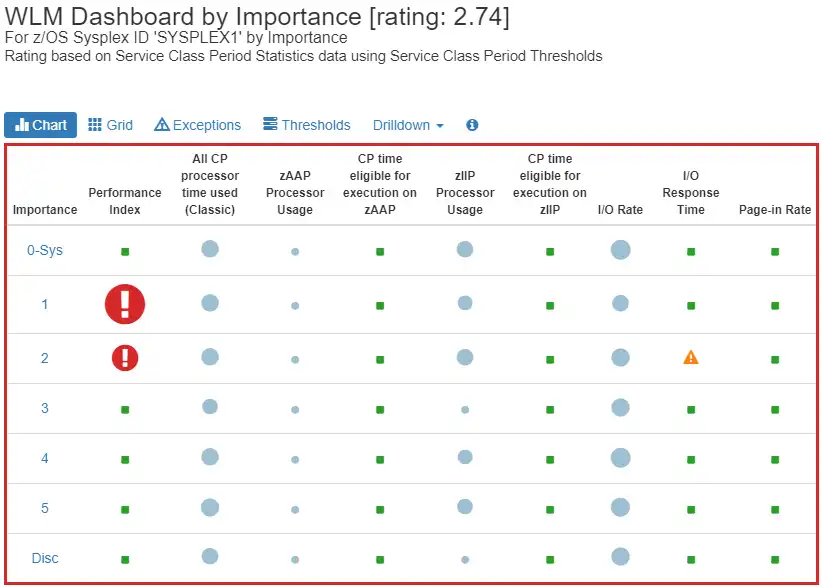
A dashboard like this could show that you need to update your service class goals in order to perform better during peak workload times. You would much rather see your importance 1 and 2 groups in “the green” rather than the red in this example.
IntelliMagic Vision has an extensive suite of WLM dashboards and reports to drill down very quickly into service class period performance. Here is one example of a multi-chart for a service class that was flagged as missing its goal.
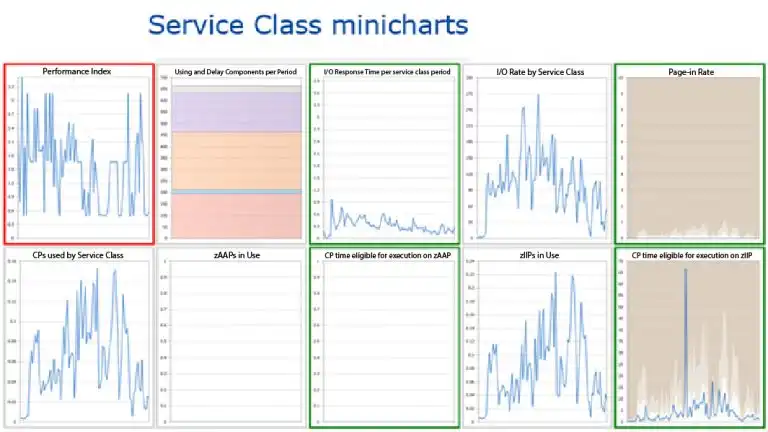
You can quickly see when the service class is missing its goal, why it’s missing its goal, and if it is “busy enough” to be a priority in your tuning efforts. Perhaps you need to make higher importance service class period goals more aggressive and/or lower importance service class period goals less aggressive.
Essential Component Example #3: Coupling Facility Performance
Another example of an area that can be challenging to monitor and track is the area of coupling facility performance. If all of your z/OS infrastructure components are healthy except your coupling facility requests, then your business can still be heavily impacted.
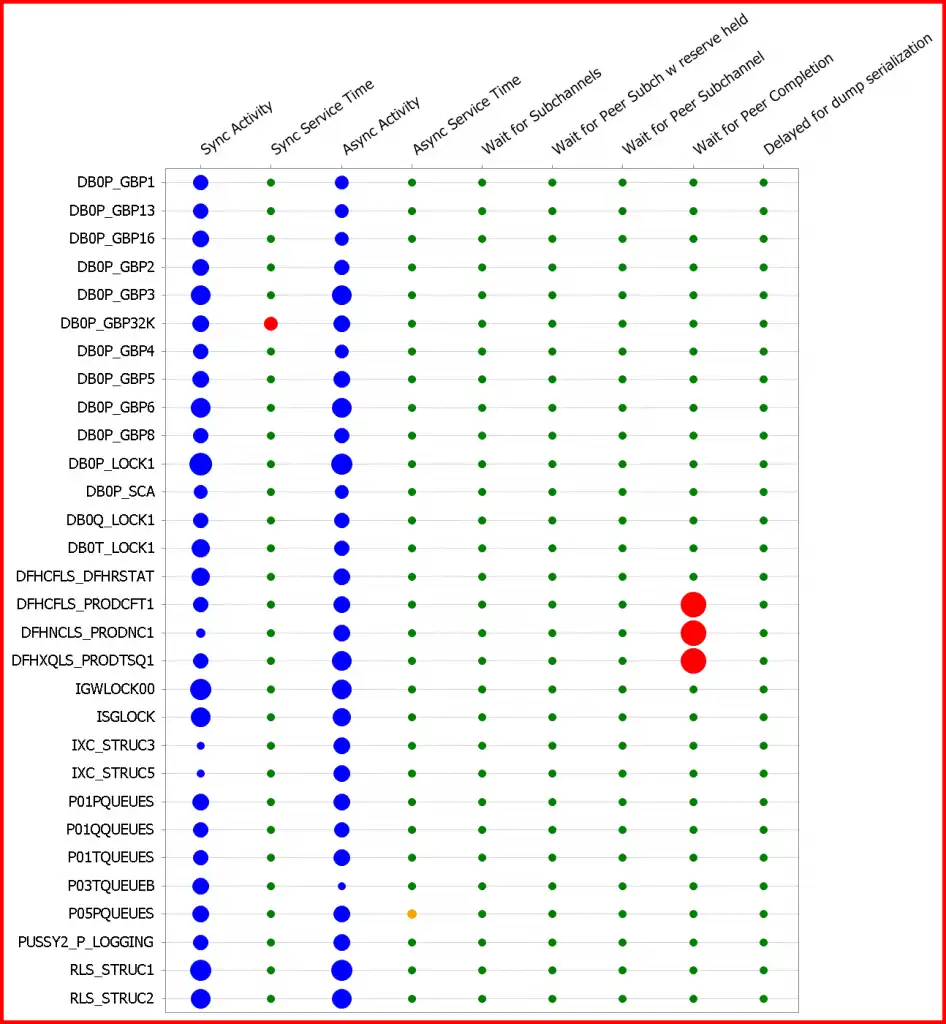
IntelliMagic Vision has an extensive set of coupling facility dashboards and other reports that can make the health assessment of your coupling facility very easy. Here is an example of one of the higher-level coupling facility dashboards. What jumps out is that one structure is getting poor synchronous service times, which should be addressed with some urgency.
Visibility is The Key to Avoiding an Iceberg Collision
Keep in mind that it is vital to your business’ success to have software that can do expert analysis in seconds.
One of the most famous examples of a collision with an iceberg is the story of the Titanic. Did you know that the ill-fated maiden voyage of that ship included one small, but important detail? The key to the locker that contained the binoculars was accidently carried off of the ship before the Titanic set sail, so the visibility to watch for icebergs ahead was hindered.
Do not repeat the mistake in your z/OS system. Make sure you have the visibility to look for your icebergs below the surface.
In the previous three examples, I showed that you need to forecast, monitor, and track for DASD. You need to ensure your WLM policy is ready for peaks. And, you need to make sure your coupling facility service requests can also handle your peak workload times.
You need to be able to monitor and track your capacity plan for hundreds of z/OS infrastructure components and metrics, as well as have a fast mean-time-to-resolution when the unexpected happens. On a daily basis, you need to be able to answer questions like:
- Are the number of CICS transactions coming into my system expected?
- Are my DB2 databases healthy and ready to handle additional work?
- Can my tape subsystem deal with expected peak traffic?
- Can my MQ and TCP/IP infrastructure handle any more work?
- … and so on …
Managing the z/OS Iceberg with a Skills Gap
As the z/OS infrastructure has increased in complexity and responsibility, your company now has to begin thinking of the health of every piece of the z/OS infrastructure – significantly more than just CPU utilization. This rise in complexity has unfortunately been combined with a decreasing number of qualified z/OS professionals thanks to the z/OS performance skills gap.
This makes qualified, efficient, handling and management of the z/OS infrastructure more vital than ever.
Gone are the days of only putting together a spreadsheet that showed the CPU trend line forecast for the next year. Gone are the days of adding more hardware or having a plan of adding emergency hardware if your workloads start exceeding the plan.
Also gone are the days of relying on just one person that never goes on vacation and can be reached at all hours to answer these questions for you. You need software to help and help expertly.
In addition to an intuitive and dynamic GUI-based interface, IntelliMagic Vision analyzes and rates over 700 z/OS metrics. Those ratings can look ahead for you, help you, and identify that iceberg up ahead so you can navigate around it.
This article's author
 Jerry Street
 Share this blog
Related Resources
What's New with IntelliMagic Vision for z/OS? 2024.1
January 29, 2024 | This month we've introduced updates to the Subsystem Topology Viewer, new Long-term MSU/MIPS Reporting, updates to ZPARM settings and Average Line Configurations, as well as updates to TCP/IP Communications reports.
From Taped Walls to Your PC: z/OS Configuration Made Simple with Topology | IntelliMagic zAcademy
In this webinar, we explore a technique that integrates diverse data sources from z/OS, presenting them in a clear, concise, and interactive visual format.
Making Sense of the Many I/O Count Fields in SMF | Cheryl Watson's Tuning Letter
In this reprint from Cheryl Watson’s Tuning Letter, Todd Havekost addresses a question about the different fields in SMF records having different values.
Book a Demo or Connect With an Expert
Discuss your technical or sales-related questions with our mainframe experts today