
Getting visibility into key Db2 for z/OS areas is crucial to proactively prevent performance issues from occurring and quickly resolve issues that are already in effect.
IntelliMagic Vision enables performance analysts to more effectively and efficiently manage and optimize their z/OS Db2 environment. With this solution, you will be able to:
- Proactively identify upcoming risks to your Db2 health and performance.
- Save time with quick access and intelligence about important issues.
- Easily identify trends, peaks, and imbalances in your Buffer Pools.
Db2 reporting is based on the SMF 100 Db2 statistics records, providing a robust set of metrics at the Db2 subsystem or member level. Db2 reporting is also implemented for SMF 101 Db2 accounting records, providing detailed metrics by connection type, or by plan and package level.
This reporting is provided under the Db2 viewpoint in the IntelliMagic Vision Web Reporter.
Db2 Health Dashboards
The Db2 Statistics focal point contains a set of Health dashboards, representing one of the strategic capabilities of IntelliMagic Vision. It is automatically checking the thousands of elements of your z/OS infrastructure to identify potential risks to availability.
Here applied to Db2, processing data from the SMF 100 Db2 statistics records and evaluating over 60 metrics against each data sharing group and member to identify areas that may warrant additional investigation. The following figure shows an example of a Db2 Buffer Pool Health dashboard.
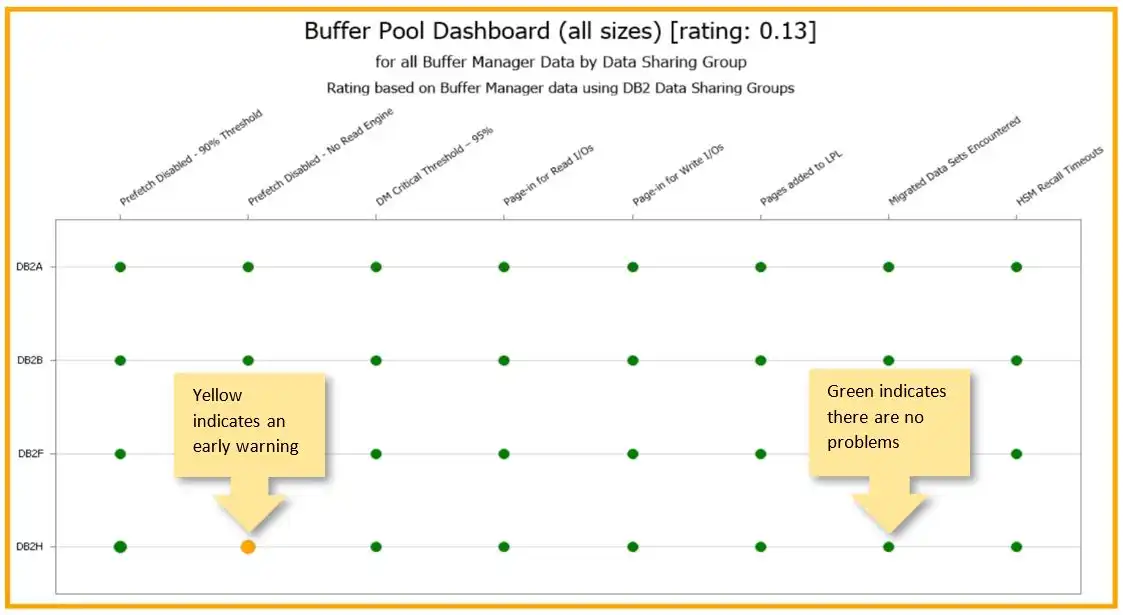
Note that the Health Dashboards use colors to indicate Early Warnings and Performance Exceptions. The rating mentioned in the Dashboard Title (0.13) is a measure for the severity of the problems, where a rating of zero would represent the ideal situation of no problems at all.
It is recommended to investigate the yellow marked Early Warnings to prevent Performance Exceptions in the near future. (Simply clicking any of the individual bubbles automatically drills down to the next level. Investigation here would begin by clicking on the yellow bubble.)
The Db2 Dashboards provide a health assessment of the Db2 performance, both from a usage (e.g. are many transactions abending or cancelled), and from a Db2 internal perspective on such aspects as buffering, logging and locking.
Most ratings are based on general Db2 best practices, but some will require fine tuning based on their specific requirements. For example, an installation relying heavily on data sharing will be tuned differently than one that is not doing data sharing.
Here is an example of the Locks and Latches Health dashboard:
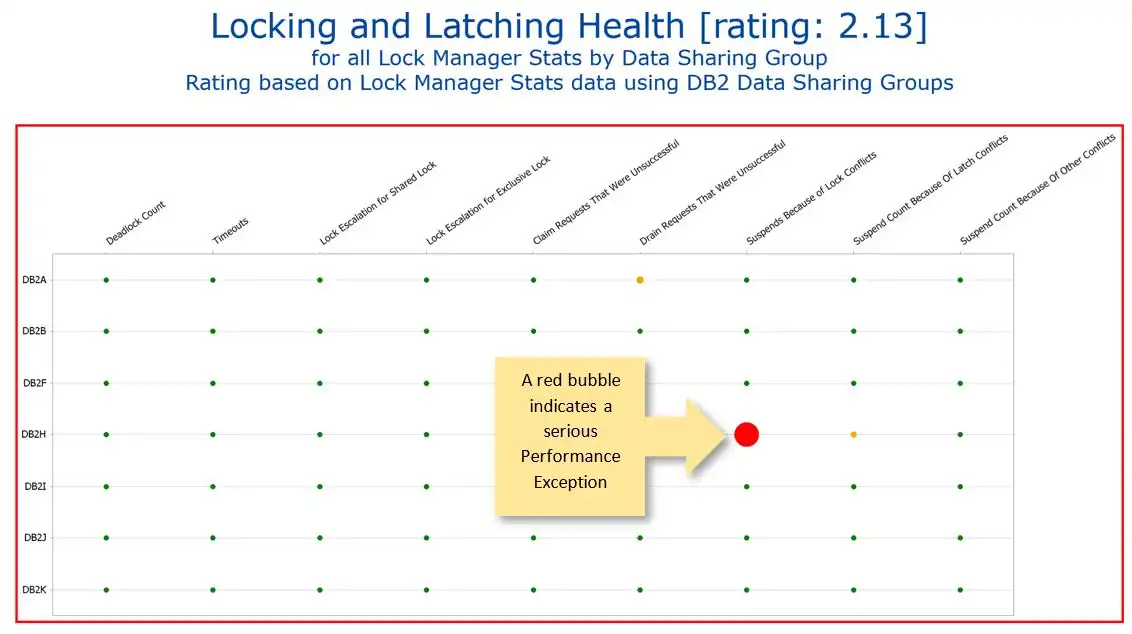
Note that this Health Dashboard has a high rating of 2.13 indicating a serious Performance Exception that should be investigated and fixed immediately. Additionally, there are two yellow bubbles indicated Early Warnings. You can click on these bubbles to drill down and locate the root causes for these issues.
In addition to the dashboards, there are many other reports based on the Db2 statistics, showing activity by data sharing group, with drilldowns to the individual Db2 subsystems. This includes areas such as:
- Commits, by data sharing group, by commit type, by authid, etc.
- Logging, including Log Throughput, etc.
- SQL statistics, including the volume of SQL statements by type over time for each data sharing group.
Db2 Buffer Pools
Key aspects of Db2 performance tuning are effective buffer pool management and exploitation of prefetch activity (to reduce synchronous read I/Os). The IntelliMagic Vision reports with buffer pool statistics and group buffer pool statistics provide visibility into Getpage, Synchronous I/O Activity and Buffer Pool Hit Ratios, along with the various types of Prefetch Activity both for Local Buffer Pools and for Group Buffer Pools in a data sharing environment.
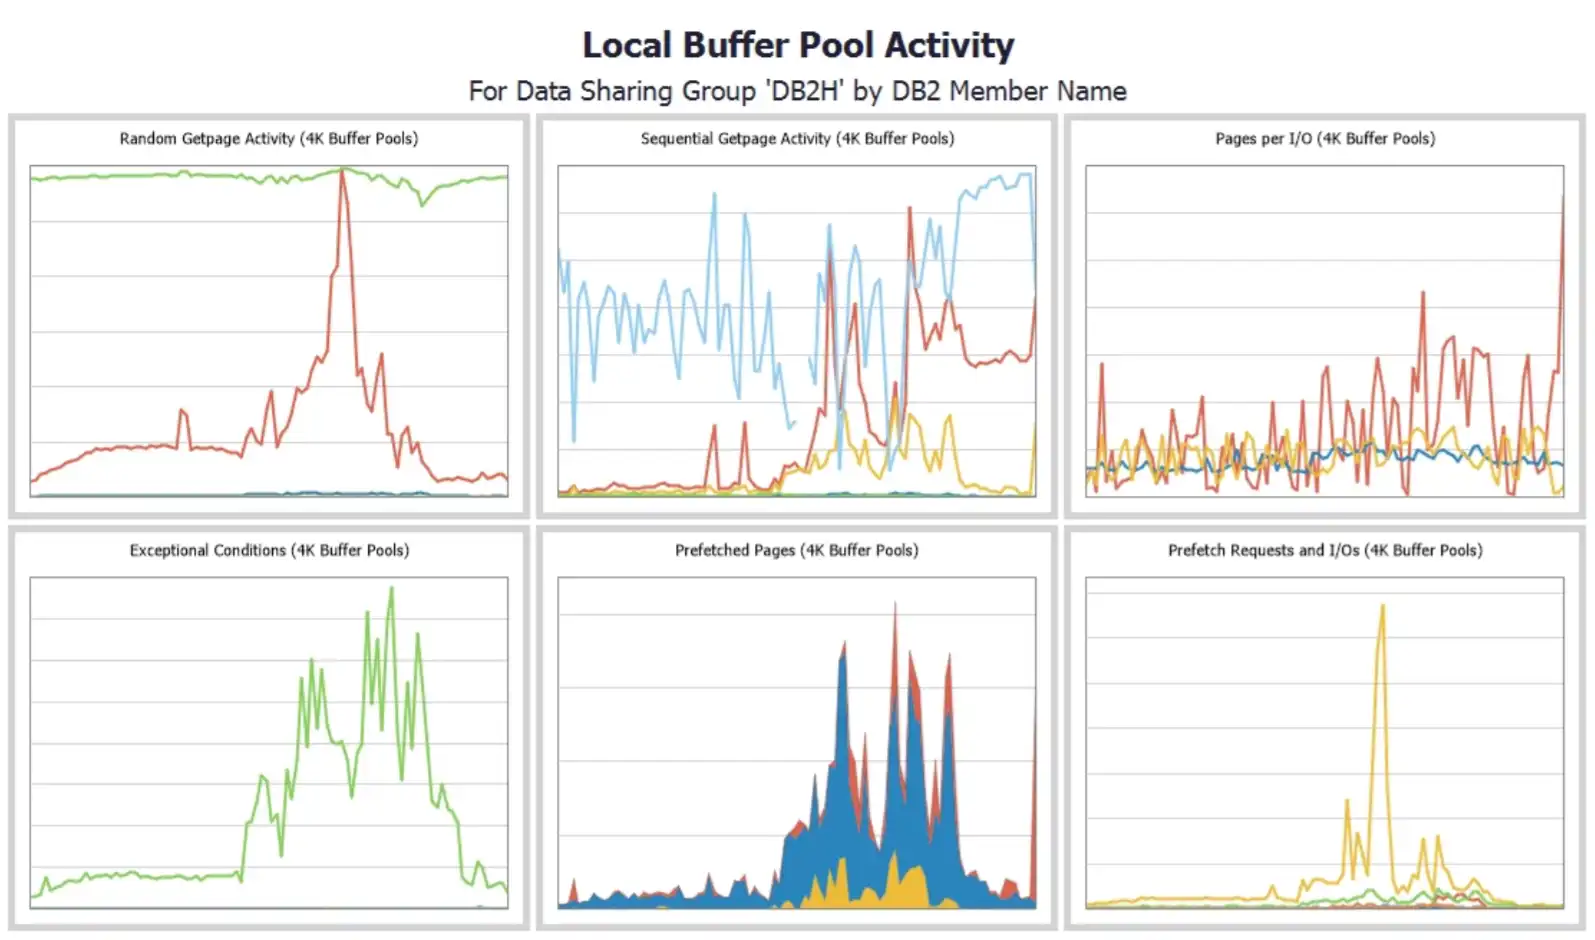
The “mini-charts” shown above provide a quick insight in several key areas of Db2 Local Buffer Pool Activity. You can just click on one of these charts to drill down deeper for more information.
Db2 Page Sets
Within the focal point Local Buffer Pools, the reports in the report set BP I/O Statistics allow for very detailed analysis of buffer pool activity. This information is calculated based on combining data from IFCID 199 dataset I/O records, IFCID 105 mapping records, and SMF 42 dataset records. Due to the large volume of data being combined, the data is provided at a resolution of one hour.
For example, using the BP I/O Statistics viewpoint, we can analyze the synchronous I/Os by first determining the top 20 buffer pools with the most synchronous I/Os, then determine the top 20 data bases for a partiular buffer pool, and then determine the top 20 page sets in that database. We can further drill down to the top 20 partitions for that page set. In the following example, we drilled down to BP21 and database GYYPARD2. The partitions are still aggregated and the synchronous I/Os are for all Db2 members in data sharing group Db2H.
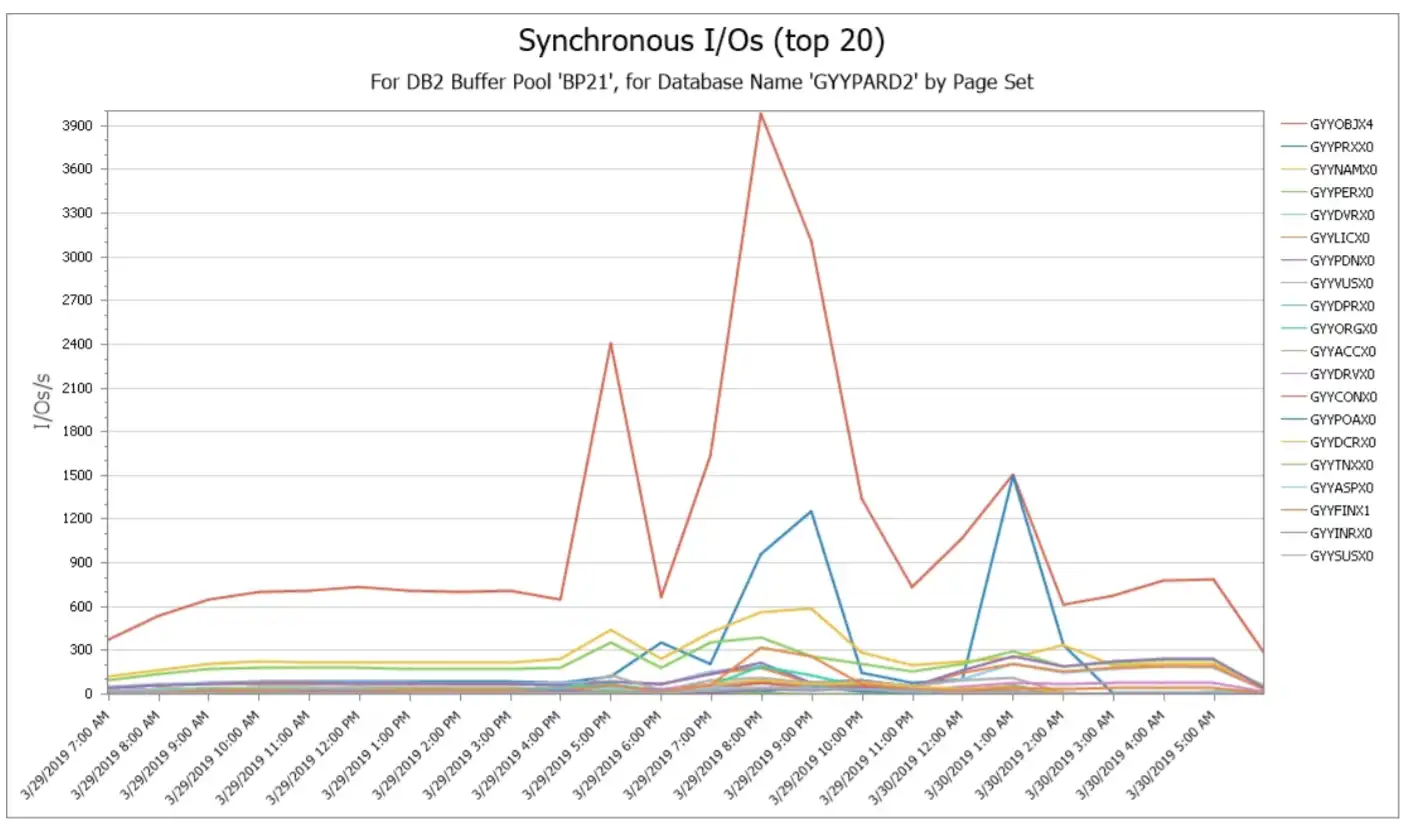
Taking this drill down one step further, after focusing on page set GYYOBJX4, we can easily access the corresponding SMF 42 records to determine the I/O response time components for the GYYOBJX4 partitions.
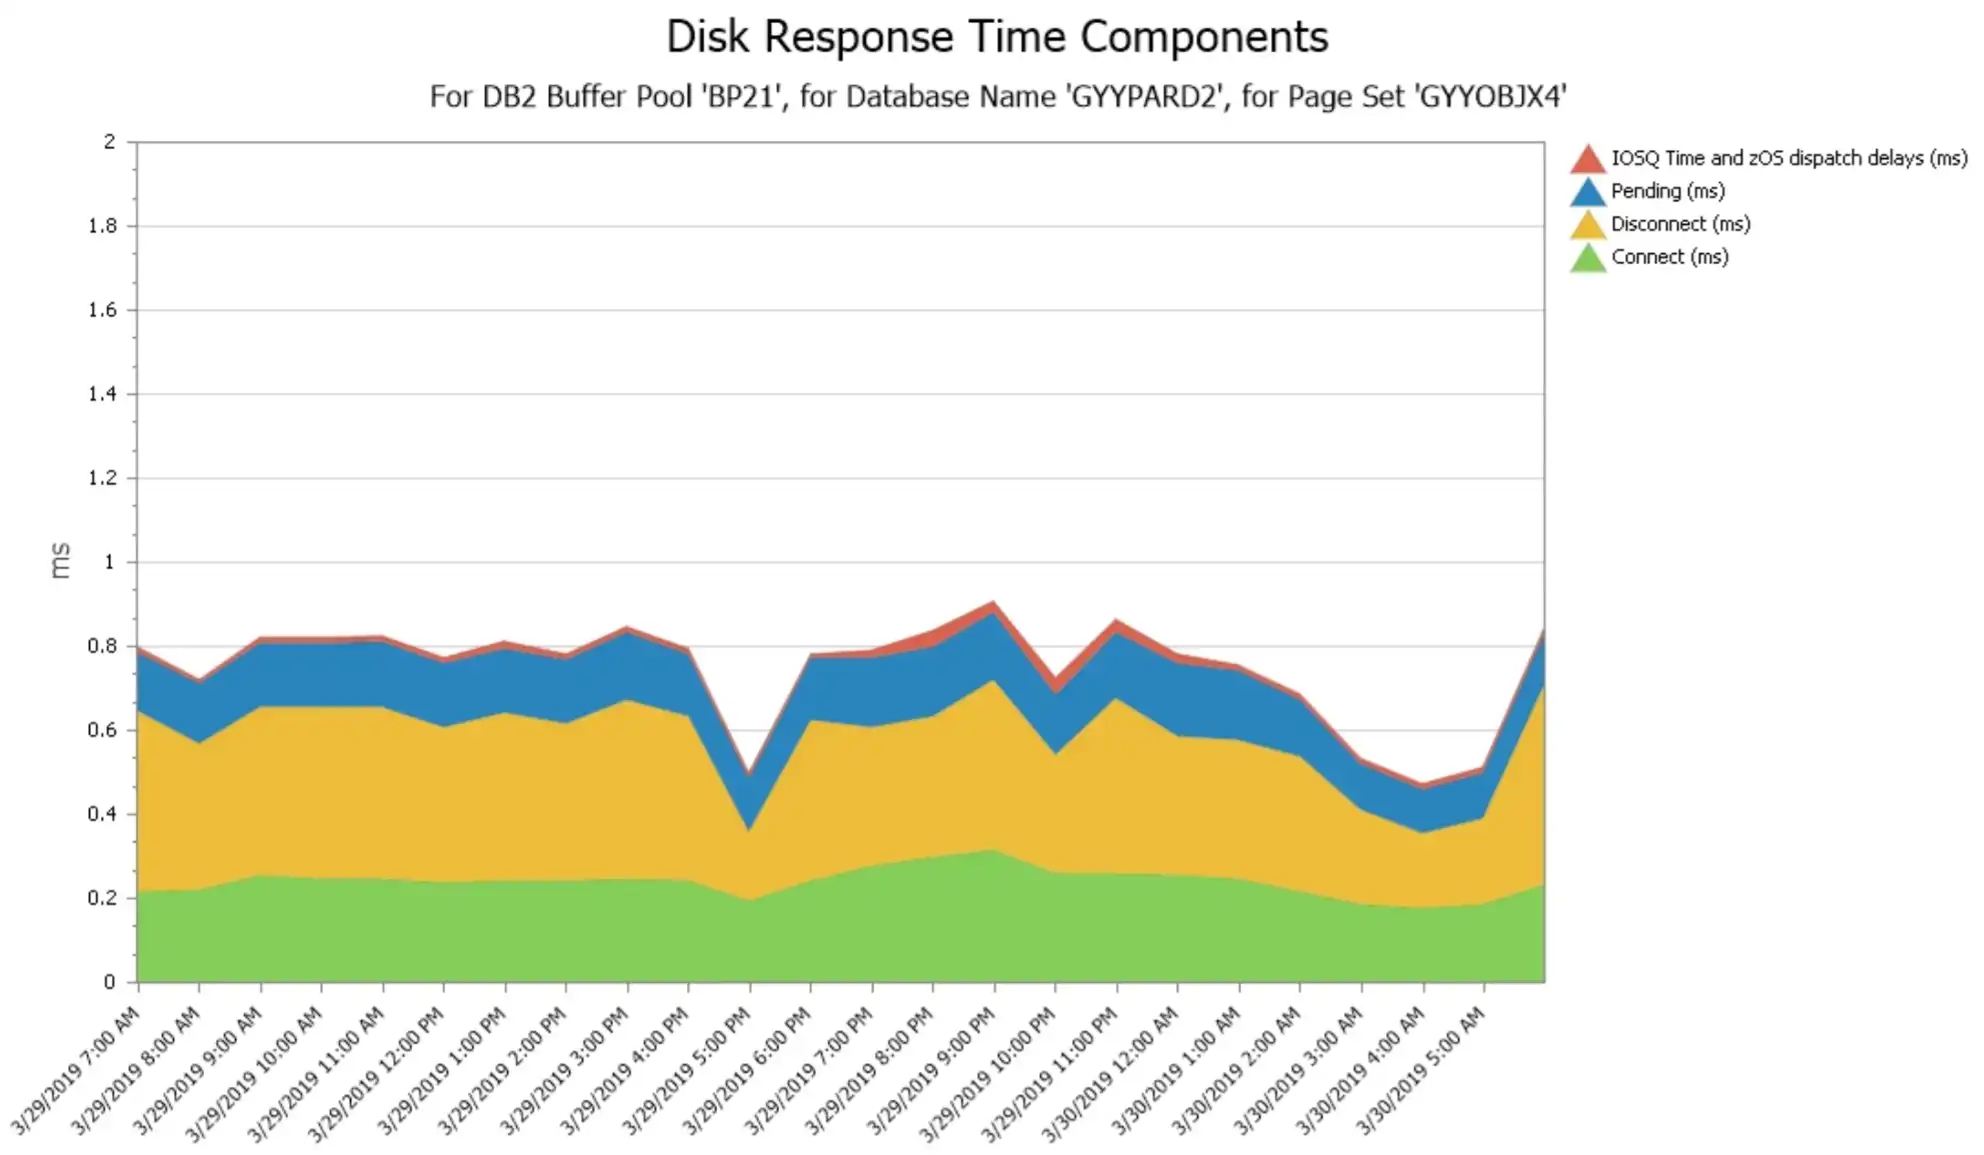
The SMF 42 records do not distinguish between synchronous and asynchronous (i.e. prefetch and asynchronous write I/Os), but the IFCID 199 records do.
Accounting by Connection Type
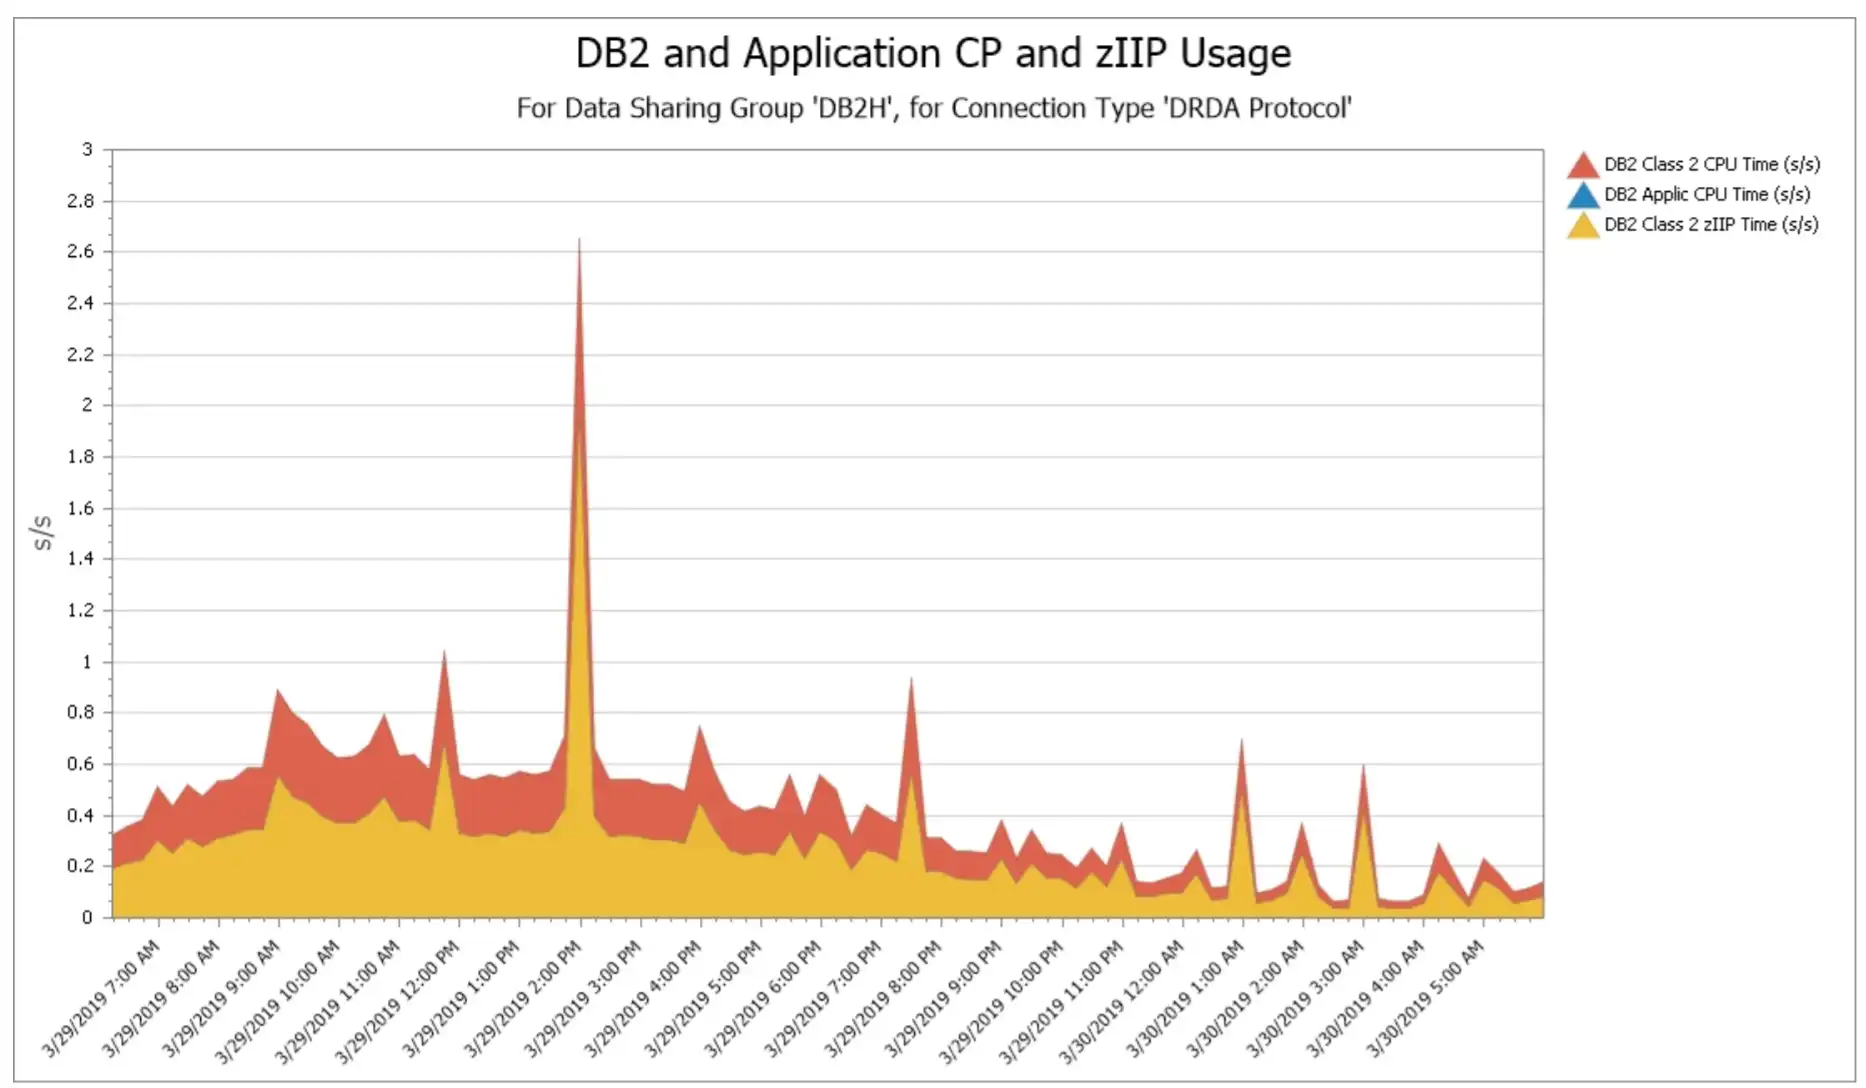
The SMF 101 Accounting records are most easily summarized by connection type, of which there are only eleven types. There is one viewpoint for each connection type. Thus, for example, you can easily analyze the transactions for CICS and find the top 20 plans used by CICS. Here is a chart showing the CPU usage for all DRDA transactions during a 24-hour period broken down by Class 2 CPU time, Class 2 zIIP time, and Application CPU time.
The focal point Plan and Package provides the performance data from the SMF101 records. This viewpoint shows the response time profiles, showing how much time the transactions spend using the CPU and waiting for various resources such as I/O, logging and locking. When both Plan and Package records are processed, you can drill down from the plan reports to see the individual packages and versions used.
For each connection type you can also drill down by plan, authid or correlation name.
Accounting by Plan
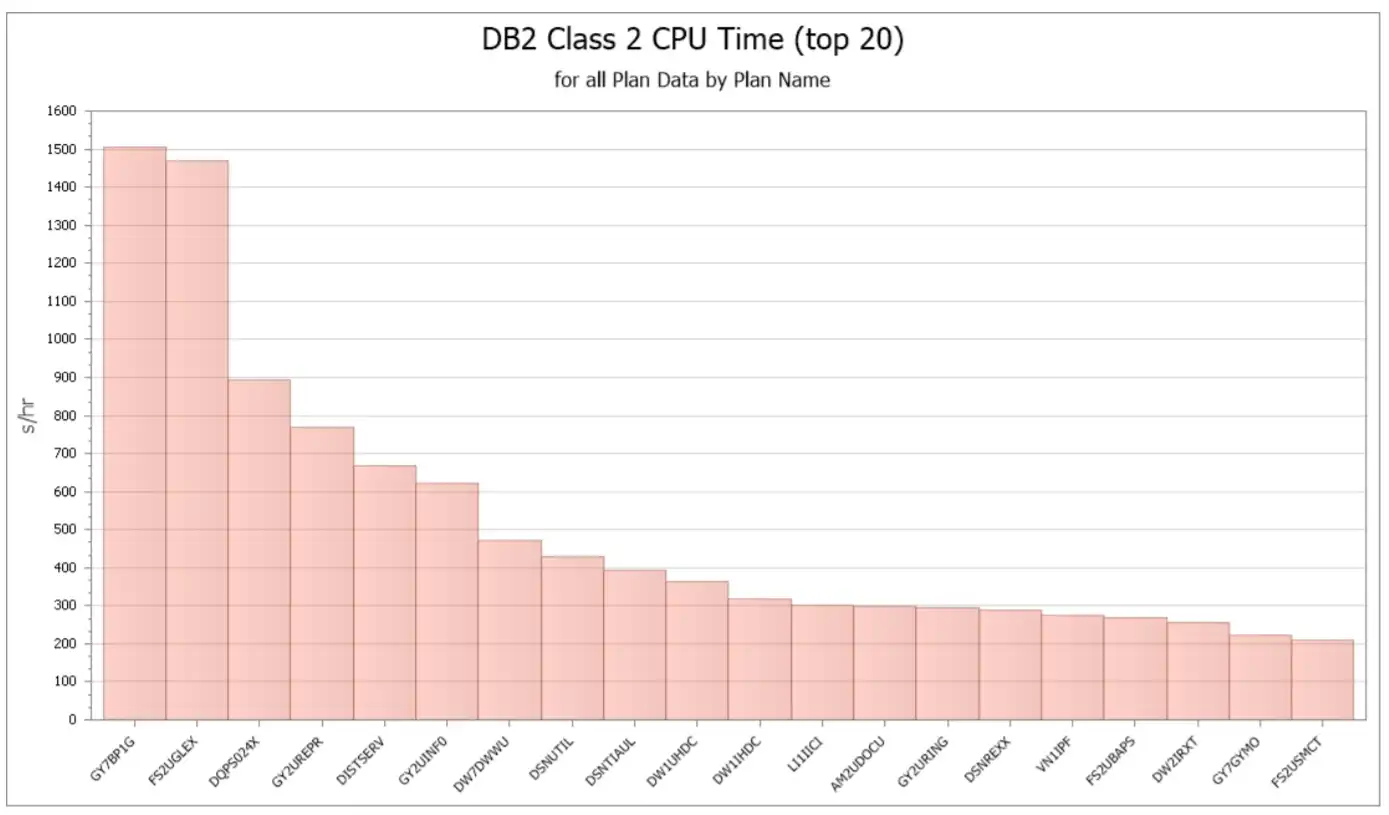
If you didn’t know which connection type was of particular interest but were interested in comparing all plans for all connection types to each other, then you might prefer the Top Plans and Packages viewpoint.
A Modern Solution to Db2 for z/OS Performance Management
Many approaches to managing and monitoring Db2 performance involve manually creating graphs and reports, sifting through thousands of metrics and data, and eyeballing static reports to find peaks and understand workload usage. IntelliMagic Vision takes advantage of AIOps to automatically generate reports that have already processed, correlated, and assessed all the metrics necessary to understand your Db2 environment and what risks there are to performance.
DBA’s suddenly can identify, hone in on, and resolve performance exceptions in a fraction of the time they’ve previous been able to thanks to capabilities such as:
- Automatic early warnings making it possible to proactively eliminate risks
- Automatic exception reports providing quick access to root causes
- Completely interactive navigation and customizable data
- Global filtering
- Historical reporting and trending to compare previous time intervals
- And combining data from multiple Data Sharing Groups in a single graph
Learn more about this modern solution to Db2 for z/OS performance monitoring at intellimagic.com/db2, or view our webinar, Analysis and Monitoring of Db2 & CICS SMF Performance Data.
This article's author
 Jeff Berger
 Share this blog
Related Resources
What's New with IntelliMagic Vision for z/OS? 2024.2
February 26, 2024 | This month we've introduced changes to the presentation of Db2, CICS, and MQ variables from rates to counts, updates to Key Processor Configuration, and the inclusion of new report sets for CICS Transaction Event Counts.
Viewing Connections Between CICS Regions, Db2 Data Sharing Groups, and MQ Queue Managers
This blog emphasizes the importance of understanding connections in mainframe management, specifically focusing on CICS, Db2, and MQ.
What's New with IntelliMagic Vision for z/OS? 2024.1
January 29, 2024 | This month we've introduced updates to the Subsystem Topology Viewer, new Long-term MSU/MIPS Reporting, updates to ZPARM settings and Average Line Configurations, as well as updates to TCP/IP Communications reports.
Book a Demo or Connect With an Expert
Discuss your technical or sales-related questions with our mainframe experts today