Prevent Availability Risks and Optimize Db2 Performance
The volume and complexity of Db2 Statistics data and Db2 Accounting data creates a major challenge for analysts who want to derive value from the rich metrics available.
Easy visibility into key Db2 metrics through SMF records is crucial to proactively prevent availability risks and to effectively manage and optimize performance.

Analyze and Optimize Db2 Performance with Built-In Health Insights and AI

Proactively Analyze and Prevent Risks
Utilize built-in health insights and artificial intelligence to proactively identify risks, ensure availability, and optimize your Db2 environment.
Save Time and Quickly Resolve Issues
Quickly spot and resolve issues using thousands of out-of-the-box reports, built-in live edit, compare, share, and drill down features.

Expedite Learning and Enhance Domain Expertise
Detailed built-in explanations, guided drilldown options, and end-to-end z/OS support facilitates easy system understanding and knowledge transfer.
Comprehensive Solutions to Your Db2 Performance Management Issues
Quickly Troubleshoot Db2 Performance Issues
Reduce Mean Time To Resolution for unpredictable problems.
Key Features
Automated alerts and intuitive drill downs ensure that when performance or availability issues occur, the root cause is quickly identified and resolved before end-users are impacted or resources wasted.
Discover potential issues before they occur with automated site assessments and easily resolve them
Discover potential issues before they occur with automated site assessments and easily resolve them
Tune and Optimize Db2 Performance
Tune and optimize your Db2 performance for maximum efficiency.
Key Features
Built-in AI-based health and performance insights and recommendations guide you towards sub-optimal areas impacting performance and availability and provide an intuitive and easy way to resolve and optimize your Db2 environment.
Comprehensive pre-built reports provide day-one access to tuning recommendations and overall site health.
Comprehensive pre-built reports provide day-one access to tuning recommendations and overall site health.
Extensive Report-Customization and Integrations
Easily integrate data from different sources and customize reports.
Key Features
Integrating data, such as from CICS, IFCID 199, or other SMF sources provides insights Db2 data alone cannot. Utilize built-in report customization and data integrations to take full control of your data and provide answers to any of your questions.
Edit, expand, and customize reports with built-in options to add sources, hone in on specific data, view data in different ways, and more.
Edit, expand, and customize reports with built-in options to add sources, hone in on specific data, view data in different ways, and more.
Identify Db2 Performance Trends and Anomalies
Gain elevated insights and predictability with trending and anomaly detection.
Key Features
AI-based anomaly detection alerts you to significant changes based on your specific baselines so issues that cannot be detected due to normal performance constraints are immediately found.
Trending and compare features provide critical before/after views and help you understand performance and resource utilization trends of your Db2 servers.
Trending and compare features provide critical before/after views and help you understand performance and resource utilization trends of your Db2 servers.
Built-In Intelligence at Your Fingertips
Health Insights Assessments – Enterprise-wide
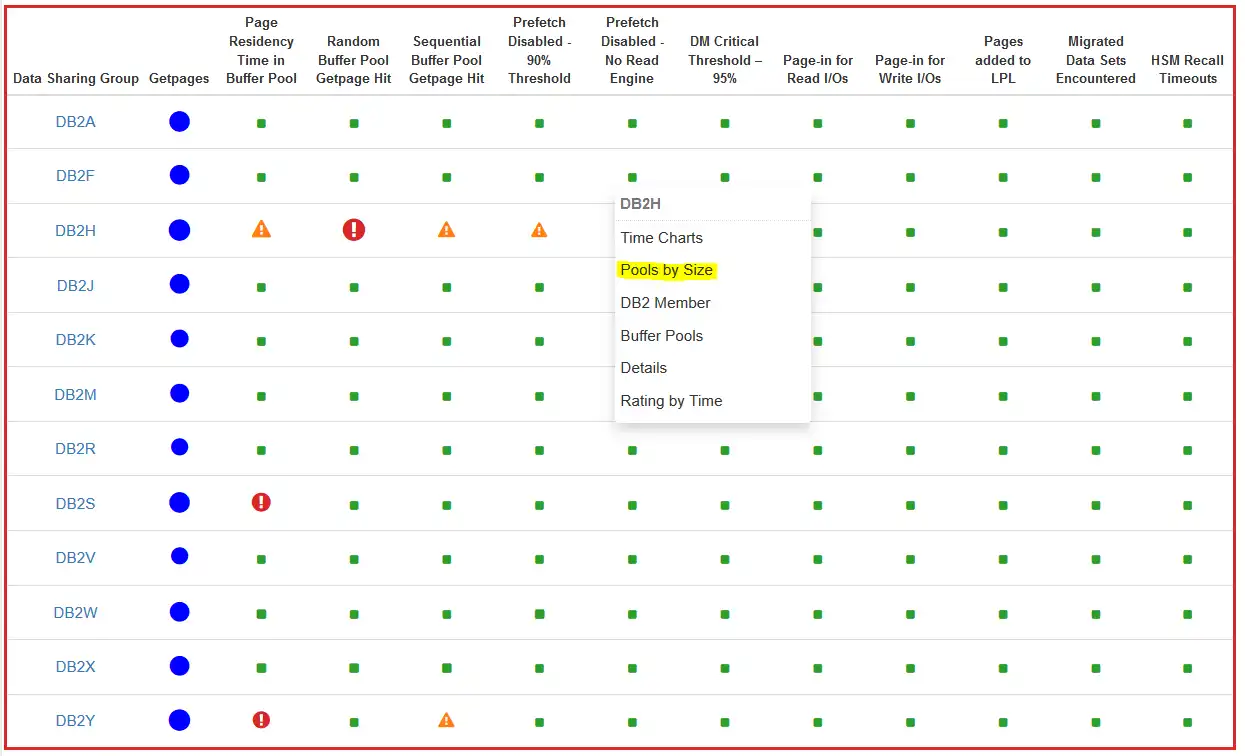
Automated assessments of 80+ metrics for every Db2 member and buffer pool in your environment help identify potential risks to availability and performance.
In this example with key Buffer Pool metrics, exceptions relating to hit ratios and page residency times are identified for every data sharing group and presented in a single easily consumable view.
Health Insights Assessments – Focused Views
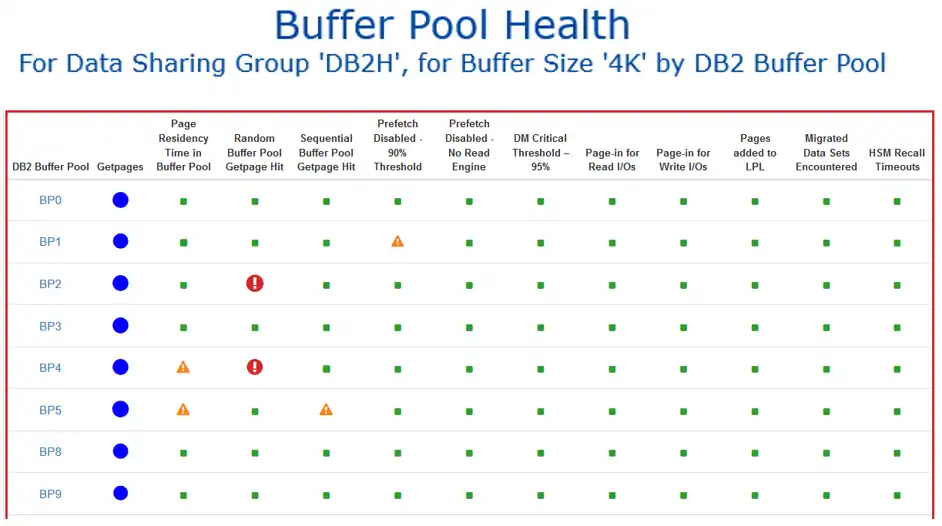
Numerous drilldowns are available to move from a high-level enterprise-wide view into focused analysis to help identify actionable insights for specific Db2 members, buffer pools, etc. The following image captures the outcome of two such drilldown steps, initially “Pool by Size” (not shown, indicating these exceptions are occurring in buffer pools belonging to the set of 4K buffers) and then by “Buffer Pool” to isolate the exceptions to specific buffer pools (shown here).
Health Insights Assessments – Time Charts
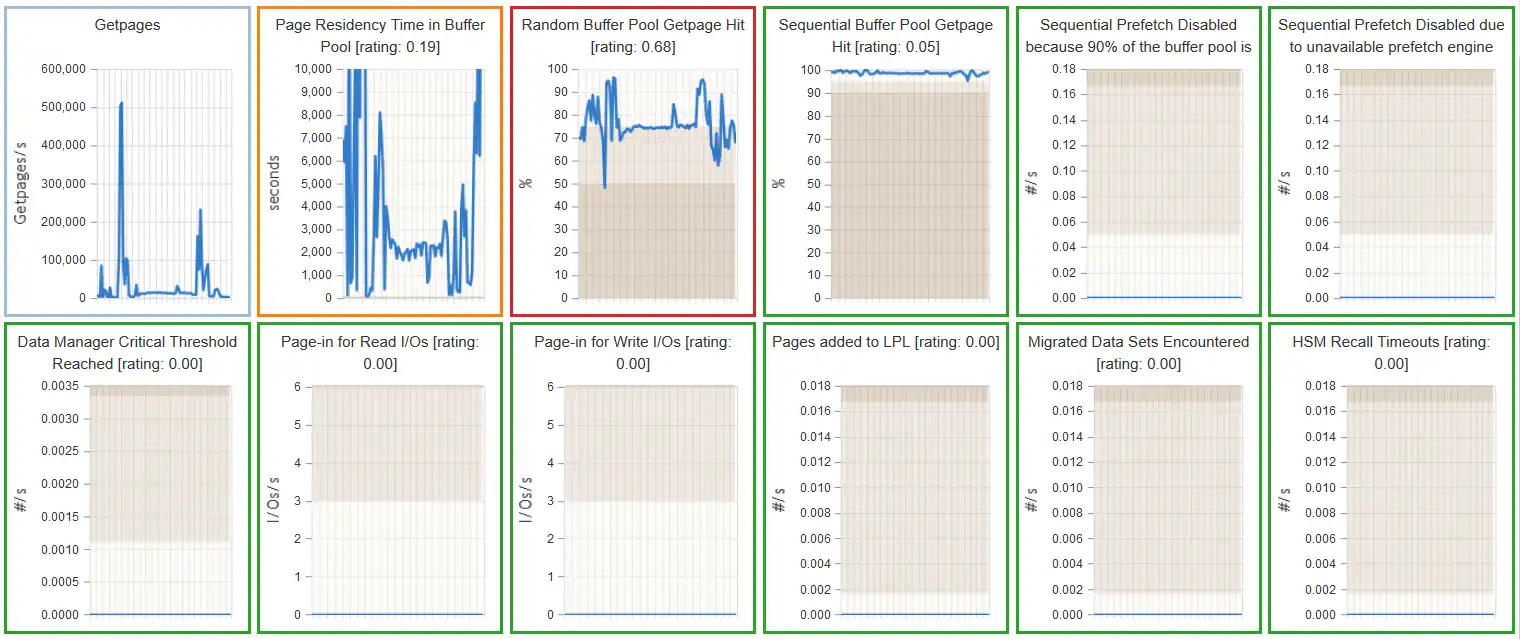
At any phase of the analytical process “Time Charts” of all assessed metrics can be generated to examine potential high-level relationships between the metrics. In this example, possible time-of-day correlations between the two metrics with exceptions (with the orange and red borders) and overall getpage activity (in the first chart) can be evaluated, and any specific metric can be selected for more detailed analysis.
Extensive Visibility into Buffer Pool and I/O Metrics
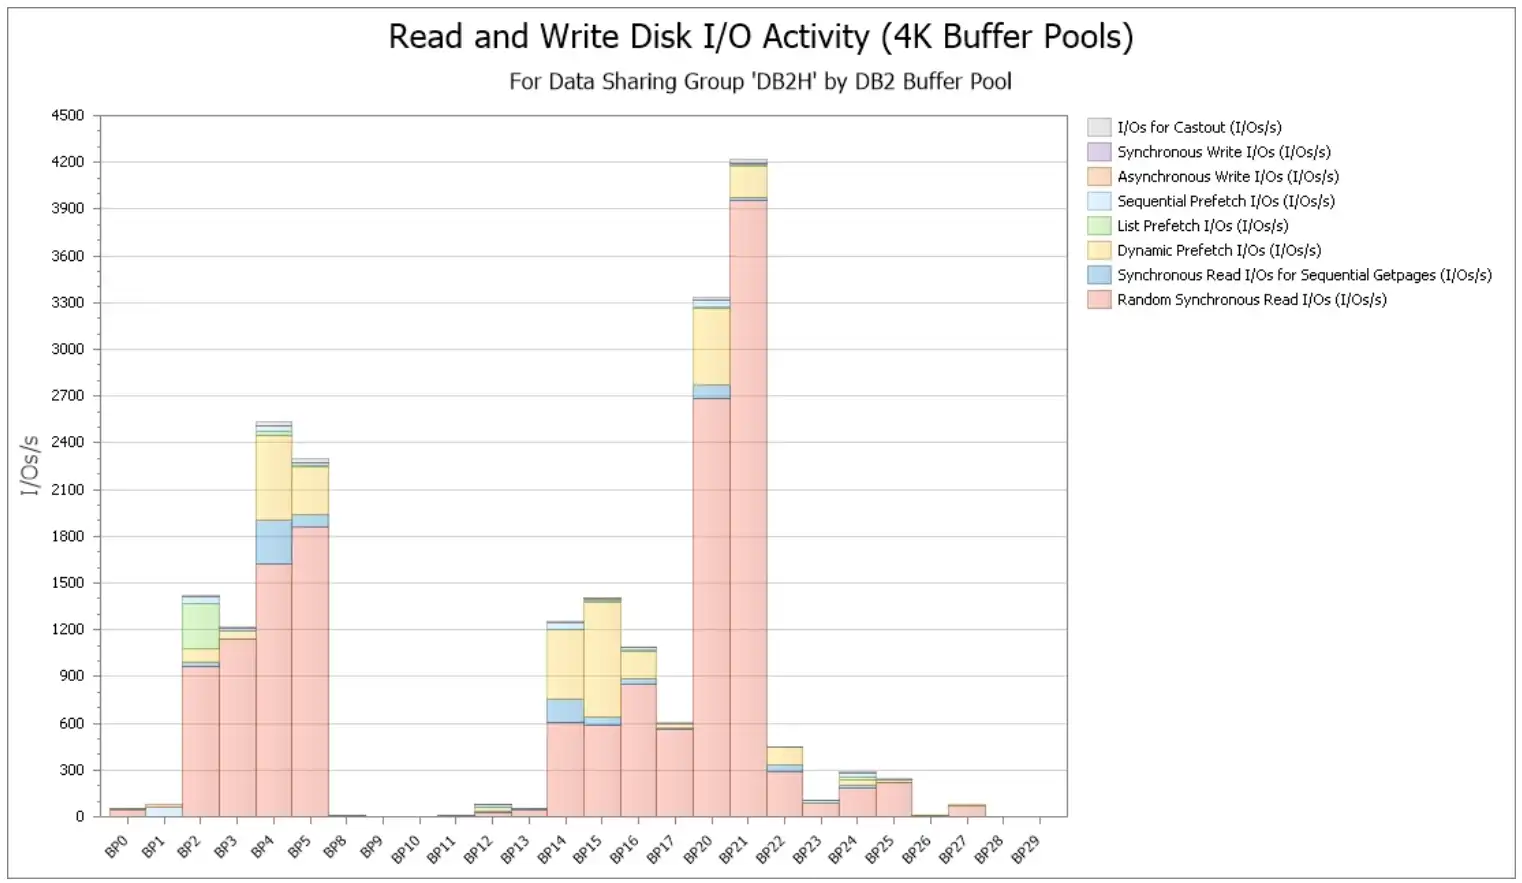
Since Db2 relies on having needed data residing in a buffer to avoid I/Os that are synchronous with the unit of work (“random sync read I/Os”), extensive visibility into buffer pool and I/O metrics is crucial for Db2 performance tuning.
Seamlessly Integrate Statistics and Accounting Data
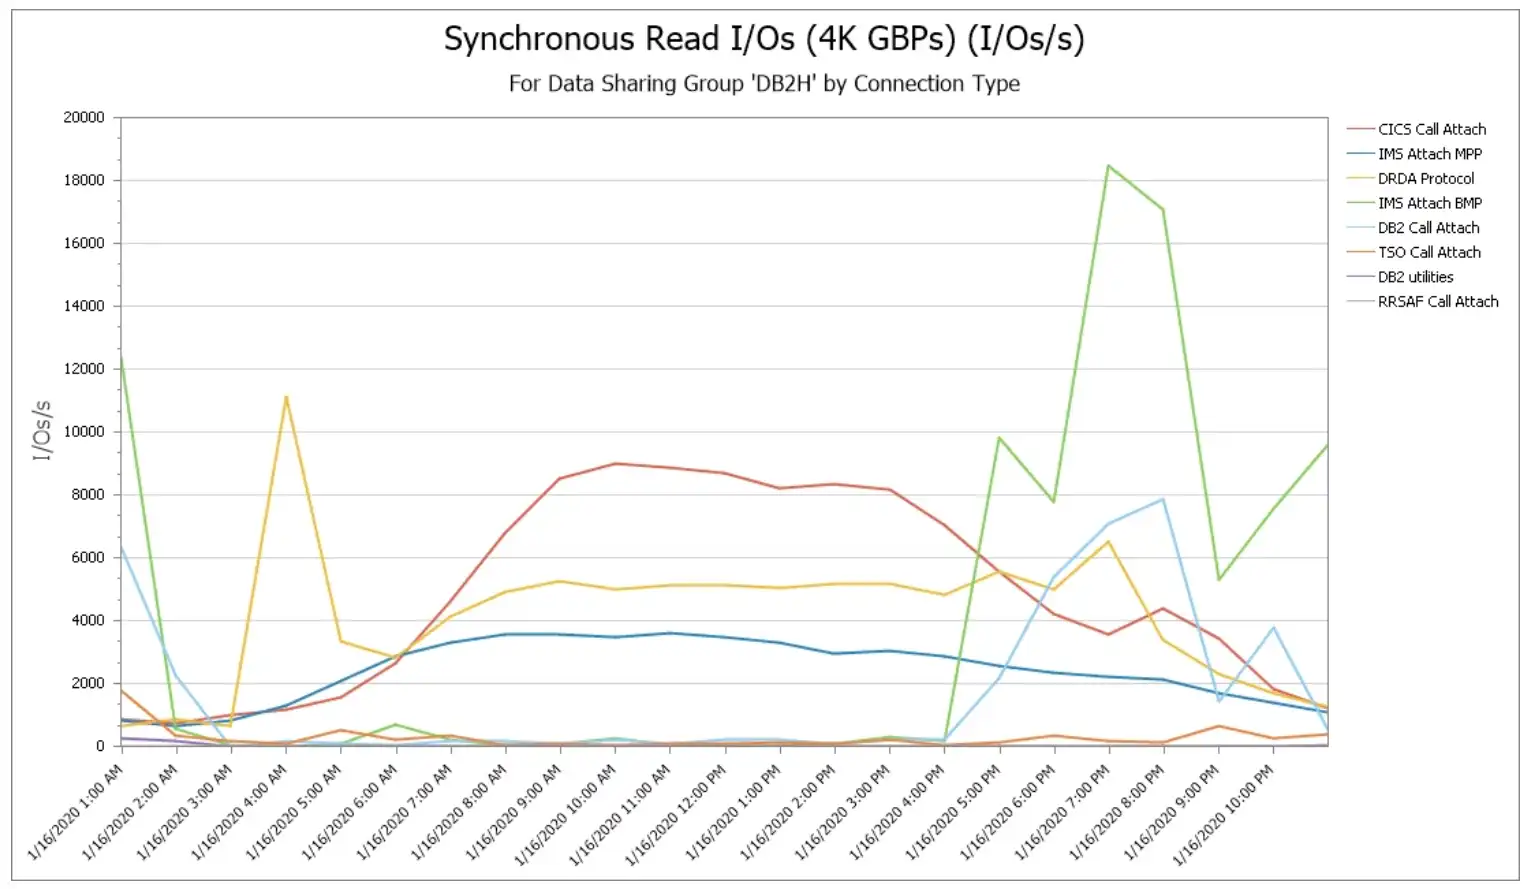
Context-sensitive drilldowns are especially powerful when working with large quantities of data, enabling you to zero in on the subset of data pertinent to the specific type of analysis currently being performed. As one example, industry Db2 performance experts frequently suggest analyses focused by connection type, since online work (e.g., coming into Db2 from CICS) typically has a very different profile from batch work (e.g., coming in through IMS batch BMPs).
In this example, a drilldown seamlessly integrates connection type (from Accounting data) with sync read I/Os (from Statistics data) to create this time of day profile.
Integrated Visibility into Db2 I/O Statistics by Buffer Pool and Database
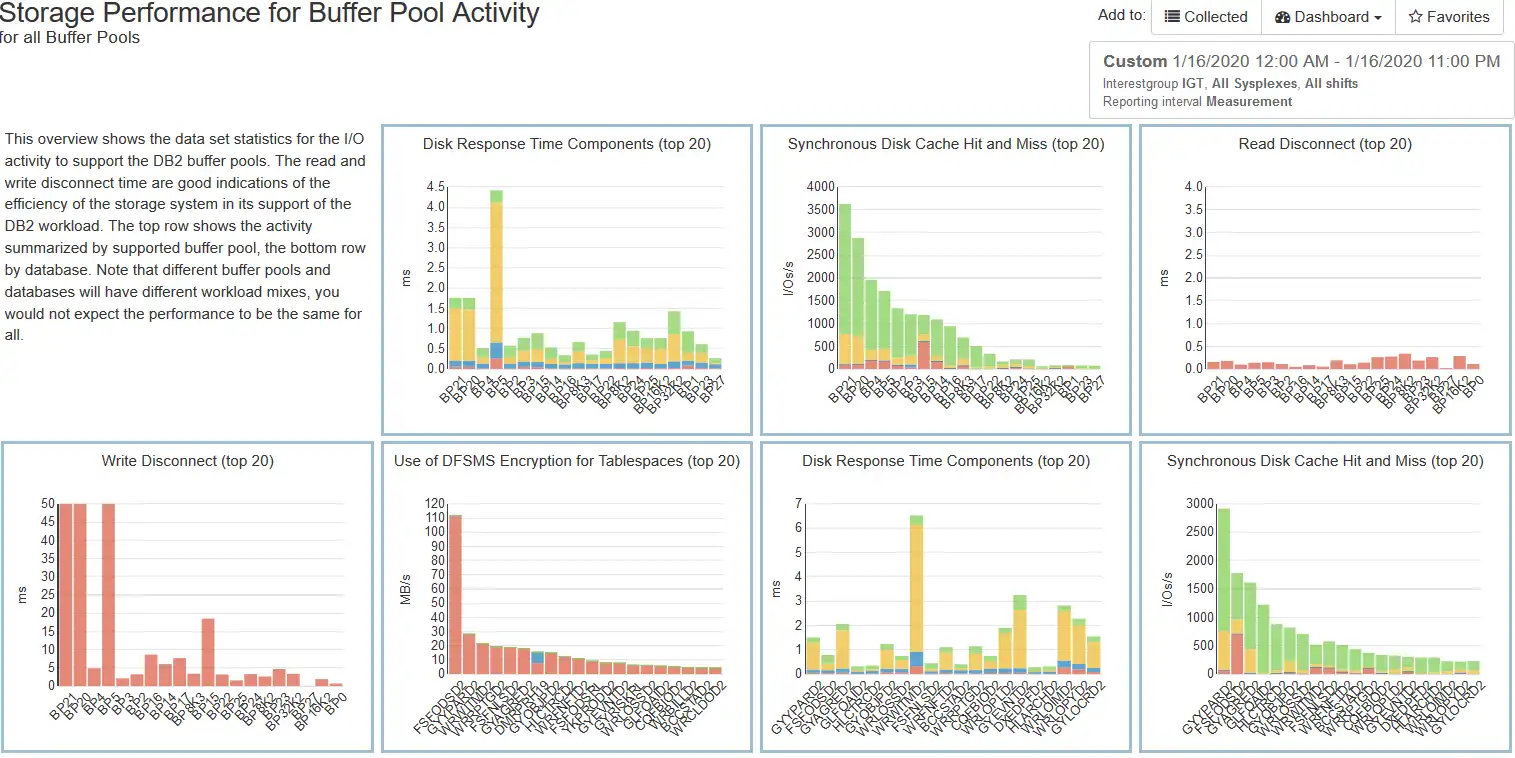
Powerful insights into disk I/O and cache performance by Db2 buffer pool and database can be facilitated by integrating data set I/O performance data (from SMF 42 records) with Db2 dataset I/O statistics (IFCID 199) data.
Metrics including disk response time by components (IOSQ, Pend, Disc, Conn) and disk cache hits and misses are presented, by Db2 buffer pool (along the top row) and database (along the bottom). And any of these can be selected for more detailed analysis, leveraging numerous drill-downs.
Visibility into Db2 Elapsed Time Profiles
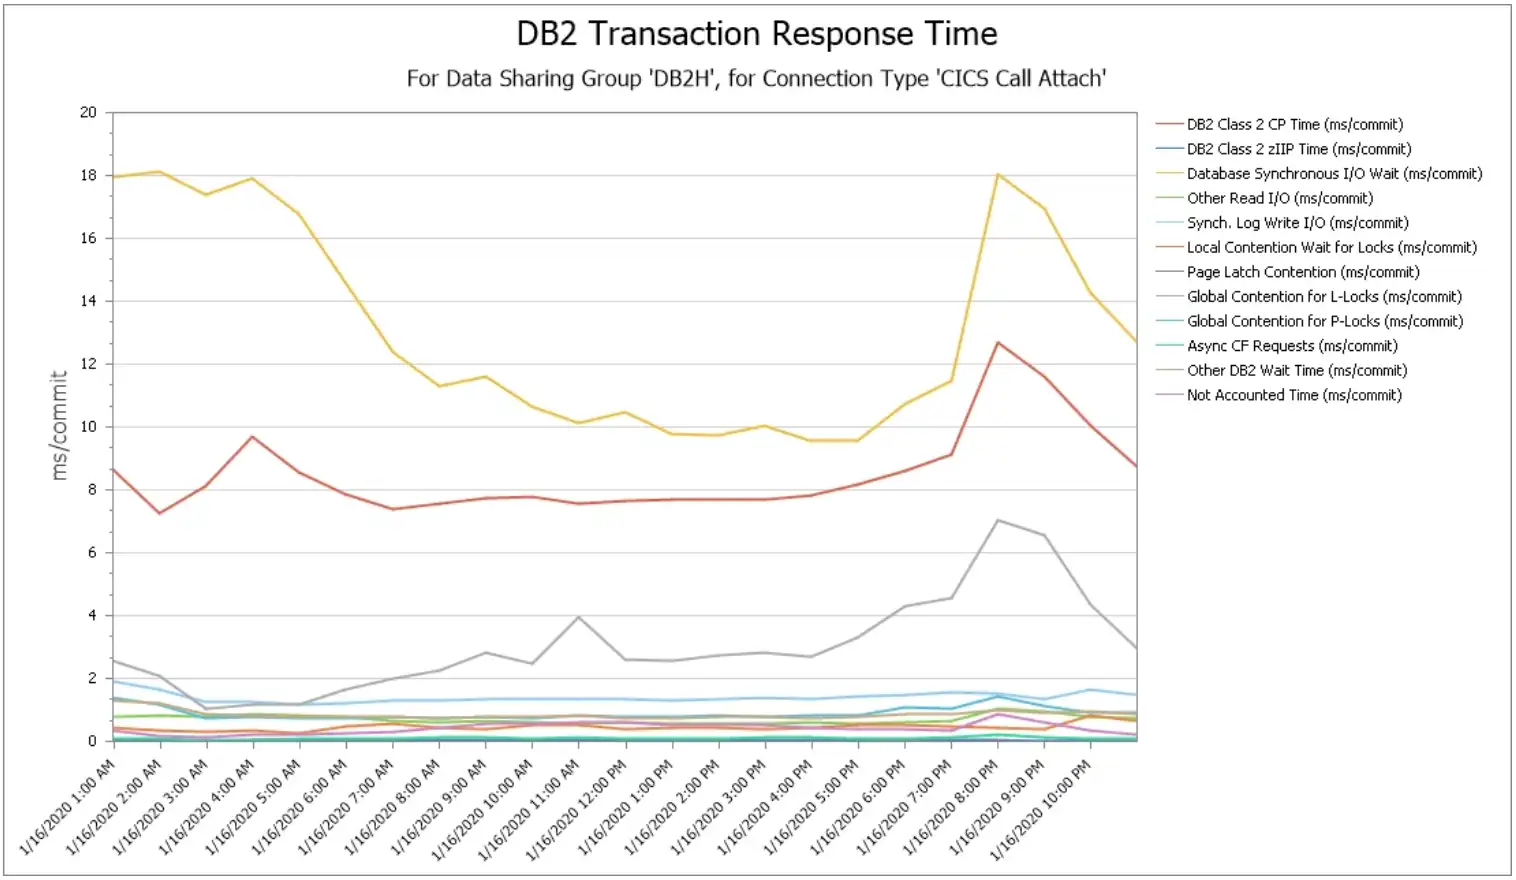
In Db2 accounting data, combining “class 2” (CPU) and “class 3” (wait) times provides an elapsed time profile of time spent within Db2.
Here we see such a profile for work coming from CICS, showing that database sync I/O time (in yellow), CPU time (in red), and Global Contention for L-Locks (gray) are the primary contributors to elapsed time.
Drilldowns by CICS Transaction ID
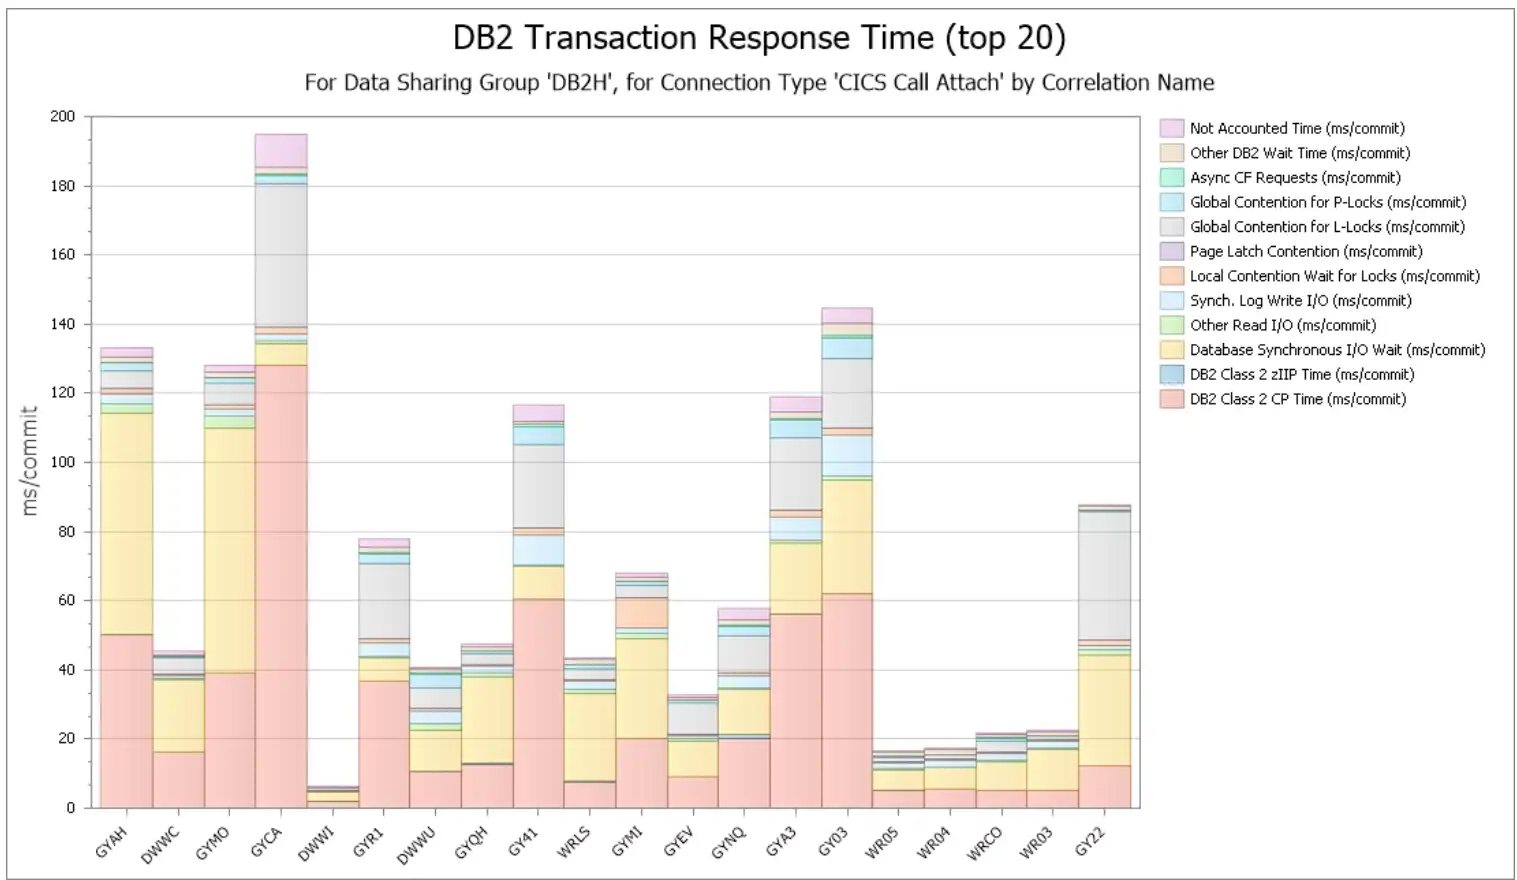
For work coming into CICS from Db2, we can take advantage of the fact that the calling transaction ID is included in the correlation name field found in the Db2 accounting data to facilitate numerous types of analyses by CICS transaction. This example presents a view of Db2 elapsed time profiles by CICS transaction.
Integration and Visual Comparison of CICS and Db2 SMF Data
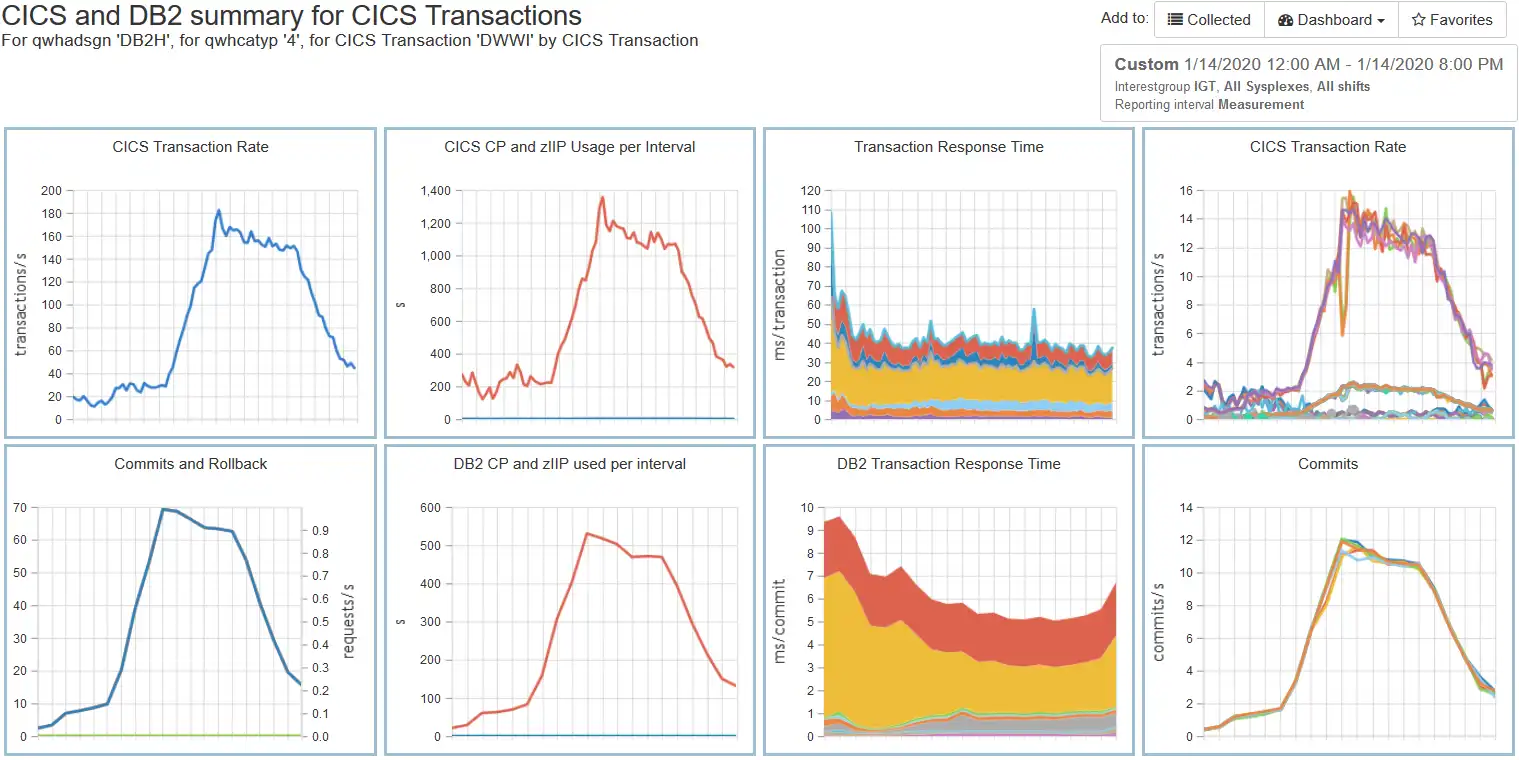
Also capitalizing on the presence of the CICS transaction ID in the Db2 correlation name field, additional integration of the measurement data produced by the two subsystems is provided. In this example, CICS SMF 110.1 transaction data (on the top row) is combined with Db2 SMF 101 accounting data (on the bottom row). This facilitates visual comparisons between the two data sources of activity rates, CPU, response/elapsed times, and activity rates by CICS region/Db2 member.
AIOps via SaaS Delivery

Advantages to adopting a cloud model include rapid implementation (no lead time to install and setup the product locally), minimal setup (only for transmitting SMF data), offloading staff resources required to deal with SMF processing issues or to install product maintenance, and easy access to IntelliMagic consulting services to supplement local skills.
Health Insights Assessments – Enterprise-wide
Automated assessments of 80+ metrics for every Db2 member and buffer pool in your environment help identify potential risks to availability and performance.
In this example with key Buffer Pool metrics, exceptions relating to hit ratios and page residency times are identified for every data sharing group and presented in a single easily consumable view.
Health Insights Assessments – Focused Views
Numerous drilldowns are available to move from a high-level enterprise-wide view into focused analysis to help identify actionable insights for specific Db2 members, buffer pools, etc. The following image captures the outcome of two such drilldown steps, initially “Pool by Size” (not shown, indicating these exceptions are occurring in buffer pools belonging to the set of 4K buffers) and then by “Buffer Pool” to isolate the exceptions to specific buffer pools (shown here).
Health Insights Assessments – Time Charts
At any phase of the analytical process “Time Charts” of all assessed metrics can be generated to examine potential high-level relationships between the metrics. In this example, possible time-of-day correlations between the two metrics with exceptions (with the orange and red borders) and overall getpage activity (in the first chart) can be evaluated, and any specific metric can be selected for more detailed analysis.
Extensive Visibility into Buffer Pool and I/O Metrics
Since Db2 relies on having needed data residing in a buffer to avoid I/Os that are synchronous with the unit of work (“random sync read I/Os”), extensive visibility into buffer pool and I/O metrics is crucial for Db2 performance tuning.
Seamlessly Integrate Statistics and Accounting Data
Context-sensitive drilldowns are especially powerful when working with large quantities of data, enabling you to zero in on the subset of data pertinent to the specific type of analysis currently being performed. As one example, industry Db2 performance experts frequently suggest analyses focused by connection type, since online work (e.g., coming into Db2 from CICS) typically has a very different profile from batch work (e.g., coming in through IMS batch BMPs).
In this example, a drilldown seamlessly integrates connection type (from Accounting data) with sync read I/Os (from Statistics data) to create this time of day profile.
Integrated Visibility into Db2 I/O Statistics by Buffer Pool and Database
Powerful insights into disk I/O and cache performance by Db2 buffer pool and database can be facilitated by integrating data set I/O performance data (from SMF 42 records) with Db2 dataset I/O statistics (IFCID 199) data.
Metrics including disk response time by components (IOSQ, Pend, Disc, Conn) and disk cache hits and misses are presented, by Db2 buffer pool (along the top row) and database (along the bottom). And any of these can be selected for more detailed analysis, leveraging numerous drill-downs.
Visibility into Db2 Elapsed Time Profiles
In Db2 accounting data, combining “class 2” (CPU) and “class 3” (wait) times provides an elapsed time profile of time spent within Db2.
Here we see such a profile for work coming from CICS, showing that database sync I/O time (in yellow), CPU time (in red), and Global Contention for L-Locks (gray) are the primary contributors to elapsed time.
Drilldowns by CICS Transaction ID
For work coming into CICS from Db2, we can take advantage of the fact that the calling transaction ID is included in the correlation name field found in the Db2 accounting data to facilitate numerous types of analyses by CICS transaction. This example presents a view of Db2 elapsed time profiles by CICS transaction.
Integration and Visual Comparison of CICS and Db2 SMF Data
Also capitalizing on the presence of the CICS transaction ID in the Db2 correlation name field, additional integration of the measurement data produced by the two subsystems is provided. In this example, CICS SMF 110.1 transaction data (on the top row) is combined with Db2 SMF 101 accounting data (on the bottom row). This facilitates visual comparisons between the two data sources of activity rates, CPU, response/elapsed times, and activity rates by CICS region/Db2 member.
AIOps via SaaS Delivery
Advantages to adopting a cloud model include rapid implementation (no lead time to install and setup the product locally), minimal setup (only for transmitting SMF data), offloading staff resources required to deal with SMF processing issues or to install product maintenance, and easy access to IntelliMagic consulting services to supplement local skills.
See Why IntelliMagic is Trusted by Some of the World’s Largest Mainframe Sites
Book a Demo or Connect With an Expert
Discuss your technical or sales-related questions with our mainframe experts today
End-to-End Infrastructure Analytics for z/OS Performance Management
zSystems Performance Management
Optimize z/OS Mainframe Systems Management with Availability Intelligence
Benefits
Optimize z/OS Systems performance management using AI-driven analytics to proactively monitor and manage your z/OS environment, prevent disruptions, reduce costs, and preserve the reliability and availability that mainframes are known for.
Explore z/OS Systems Performance Analytics
Db2 Performance Management
Prevent Availability Risks and Optimize Db2 Performance
Benefits
The volume and complexity of Db2 Statistics data and Db2 Accounting data creates a major challenge for analysts who want to derive value from the rich metrics available.
Easy visibility into key Db2 metrics through SMF records is crucial to proactively prevent availability risks and to effectively manage and optimize performance.
Explore Db2 Performance Analytics
Easy visibility into key Db2 metrics through SMF records is crucial to proactively prevent availability risks and to effectively manage and optimize performance.
CICS Performance Management
Monitor and Profile CICS Transactions and Regions with IntelliMagic Vision
Benefits
CICS SMF Transaction data is a rich source of performance insights, but its volume can make analysis challenging using traditional approaches that rely on static reports. Proactive assessment of key Statistics metrics across all regions is essential to identify potential risks to availability.
IntelliMagic Vision enables performance analysts to manage and optimize their z/OS CICS transactions more effectively and efficiently, as well as proactively assess the health of their CICS regions.
Explore CICS Performance Analytics
IntelliMagic Vision enables performance analysts to manage and optimize their z/OS CICS transactions more effectively and efficiently, as well as proactively assess the health of their CICS regions.
Virtual Tape Performance Management
Proactively Manage Virtual and Physical Tape Environments
Benefits
With tape virtualization, tape storage became easier and more economical, but at the same time, more difficult to understand which changes or hardware upgrades are the best choices. With tape libraries being shared across multiple z/OS images, the full picture can only be obtained by aggregating workload and tape hardware information from all z/OS LPARs.
IntelliMagic Vision enables performance analysts to manage and optimize their z/OS Virtual Tape environments more effectively and efficiently.
Explore Tape Performance Analytics
IntelliMagic Vision enables performance analysts to manage and optimize their z/OS Virtual Tape environments more effectively and efficiently.
Disk & Replication Performance Management
Automatically Detect Disk Performance Risks & Quickly Resolve Issues
Benefits
As Disk speeds and throughputs have increased, z/OS applications have come to rely on fast and consistent storage performance. To respond quickly to unexpected disk and replication issues, it is essential that you have insight into the health of the various components in your storage environment.
IntelliMagic Vision enables performance analysts to manage and optimize their z/OS Disk and Replication environment more effectively and efficiently.
Explore Disk Performance Analytics
IntelliMagic Vision enables performance analysts to manage and optimize their z/OS Disk and Replication environment more effectively and efficiently.
MQ Performance Management
Optimize and Analyze MQ Activity and Performance
Benefits
MQ is widely used across z/OS environments, but sites often find it challenging to derive the valuable performance insights potentially available from MQ SMF Statistics and Accounting data due to limitations in existing reporting and available tooling.
IntelliMagic Vision enables performance analysts to manage and optimize their z/OS MQ configurations and activity more effectively and efficiently, as well as proactively assess the health of their queue managers.
Explore MQ Performance Analytics
IntelliMagic Vision enables performance analysts to manage and optimize their z/OS MQ configurations and activity more effectively and efficiently, as well as proactively assess the health of their queue managers.
z/OS Network Performance Management
Automatically Monitor Mainframe Network Security and Protect Your Data
Benefits
TCP/IP is the core of the communication for the z/OS mainframe, both for traffic into and out of the mainframe and internal communication among z/OS images and processor complexes. Proper management is necessary to secure and protect system availability.
IntelliMagic Vision automatically generates GUI-based, interactive, IBM best-practice compliant rated reports that proactively identify areas that indicate potential upcoming risk to TCP/IP health, performance, and security.
Explore z/OS Network Performance Analytics
IntelliMagic Vision automatically generates GUI-based, interactive, IBM best-practice compliant rated reports that proactively identify areas that indicate potential upcoming risk to TCP/IP health, performance, and security.
z/OS Connect: Modern Mainframe API Environment
Optimizing Mainframe API Monitoring for Improved Resource Management
Benefits
IntelliMagic Vision enhances mainframe API monitoring and profiling, providing crucial visibility to address issues at the API or service level, ultimately aiding performance analysts in better resource planning and management reporting.
Explore z/OS Connect Analytics
Flexible Deployment and Monitoring

In the Cloud
Cloud based deployment can be accessed from everywhere in the world and is easy to share with colleagues

Services & Support
Take advantage of IntelliMagic's experienced performance experts for standalone custom services or daily monitoring

On Premise
Install the software on premise and use it offline for total control of your installation
Monitor Db2 Performance and Proactively Prevent Availability Risks
The volume and complexity of Db2 Statistics data (SMF 100) and Db2 Accounting data (SMF 101) data creates a major challenge for analysts who want to derive value from the rich metrics available there. Easy visibility into key Db2 metrics through SMF records is crucial to proactively prevent availability risks and to effectively manage and optimize performance.
IntelliMagic Vision automatically assesses every Db2 member (and even every buffer pool when applicable) to proactively identify potential availability risks in your environment and direct you to important issues that may warrant your attention.
In addition, the intuitive user interface and dynamic context-sensitive drilldowns available throughout IntelliMagic Vision facilitate types of analysis that are not feasible with static reporting solutions, enabling you to:
- Immediately drilldown on a specific subset of data based on observations from the current view
- Pursue one line of analysis, and if that ends up being unfruitful, quickly pursue another hypothesis with minimal wasted time and effort
- Seamlessly navigate to focus your analysis in a manner that insulates you from the fact you are dealing with massive quantities of underlying SMF data
IntelliMagic Vision offers you the out-of-the-box visibility and intuitive navigation to manage every component of your z Systems infrastructure under a single solution, facilitating collaboration across teams that have historically been isolated by siloed tool sets.
Continue Learning with These Resources
Brochures and Datasheets
White Papers
Connect With an Expert
Discuss your technical or sales-related questions with our mainframe experts today