
Getting involved in tuning your Db2 environment means diving into many levels of complexity. From subsystem-wide views down to statement-level tweaks, each approach to improving performance is important for making your system run efficiently and smoothly, reducing costs, and improving bottlenecks. Eliminating or reducing suspension times in your applications is beneficial for all users of Db2 and can greatly reduce the need to add more resources.
Db2 accounting records (SMF 101) provide many thread-level metrics, including CP times, application elapsed times, and wait (suspension) times.
IBM breaks these thread-level metrics into three classes:
- Class 1: application elapsed times
- Class 2: CP times
- Class 3: suspension times (Class 3 is further subdivided into quite a few distinct categories.)
Understanding what causes wait time in each of these categories can be instrumental in improving your subsystem and application performance. In this blog, I’ll cover some of the most common and essential wait time categories – how to spot them, and how to tune them.
Measuring Suspension Times
What is most important about wait times? Is it how much suspension time that is attributed to each transaction that executes in your environment?
Figure 1 below shows that there is very little wait time per commit in the DB2H data sharing group. This works for an environment that has transactional applications that get in and out and commit just a few times per transaction. But look at DB2W. There is a great amount of wait time there. If it is a transactional environment, then it is in a lot of trouble.
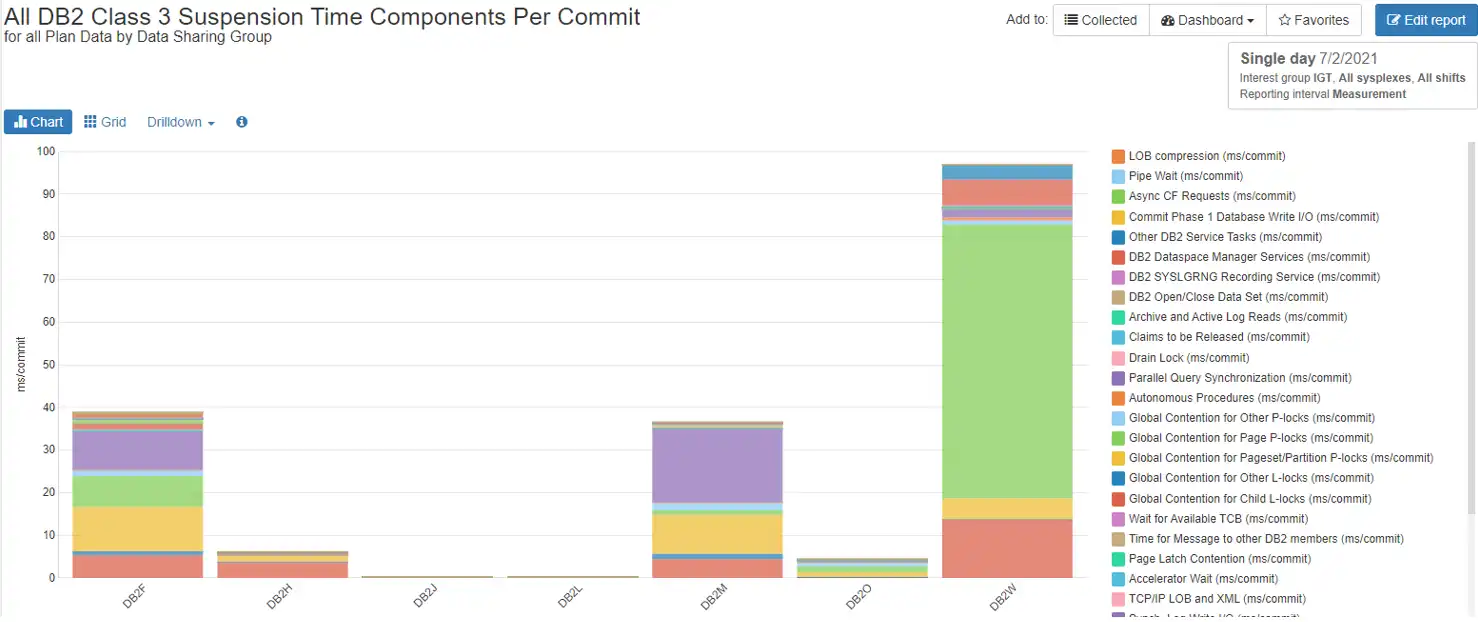
Figure 1: All Db2 Class 3 Suspension Time Components Per Commit
What happens if we look at suspension times as a cumulative value? How many times did our transactions run in DB2H? How much activity was really going on in DB2W? Figure 2 may give us some more perspective.
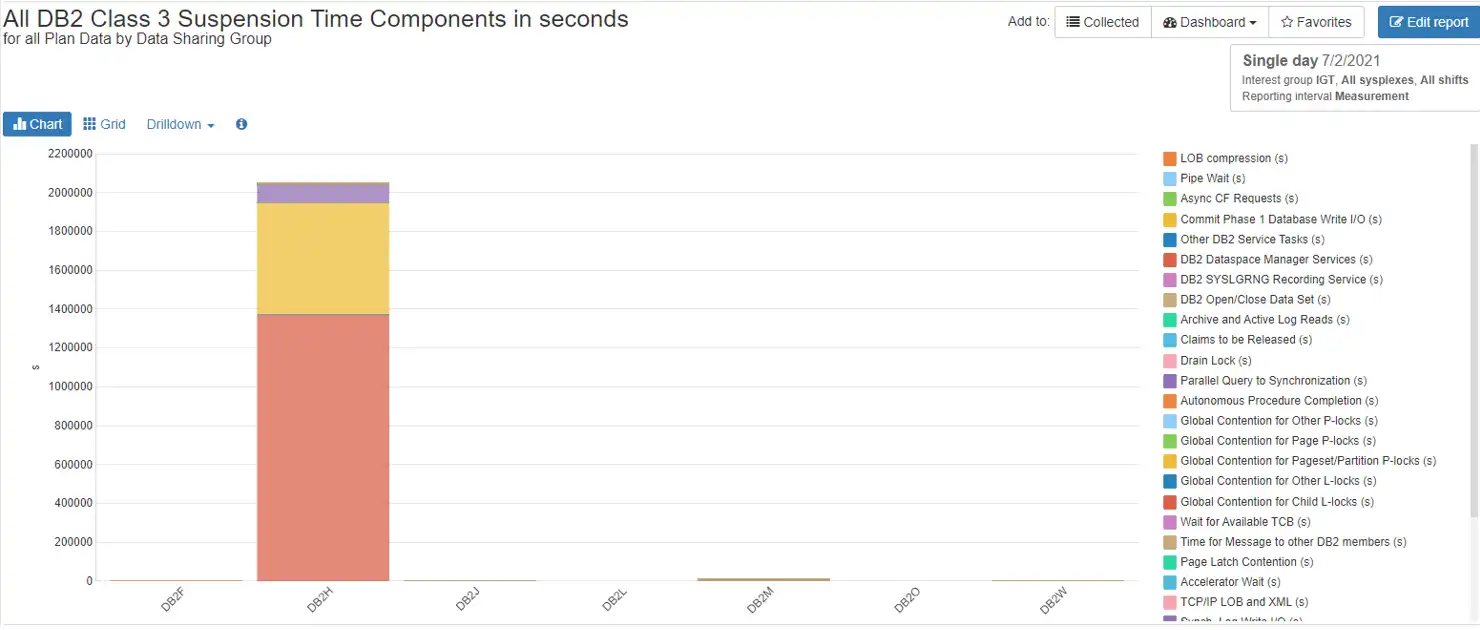
Figure 2: All Db2 Class 3 Suspension Time Components in Total Seconds
DB2H has now become the standout, and DB2W is practically imperceptible. This implies that there were a great many transactions running in DB2H whose individual wait times added up to a large number. DB2W, in comparison, had a total that is not worth looking at. Looking at suspension times from both directions gives us a view into where our tuning efforts should begin.
Of course, tuning a transaction with a very small amount of wait time that runs millions of times is much more difficult than tuning a batch program that runs only once. But if it is possible, it could save a lot of system resources.
I/O Wait Times
I/O Wait involves write and read operations for databases as well as logs. In our example, DB2H, we see that the highest amount of wait time is attributed to Database Sync I/O. Figure 3 below breaks out all of the I/O wait time.
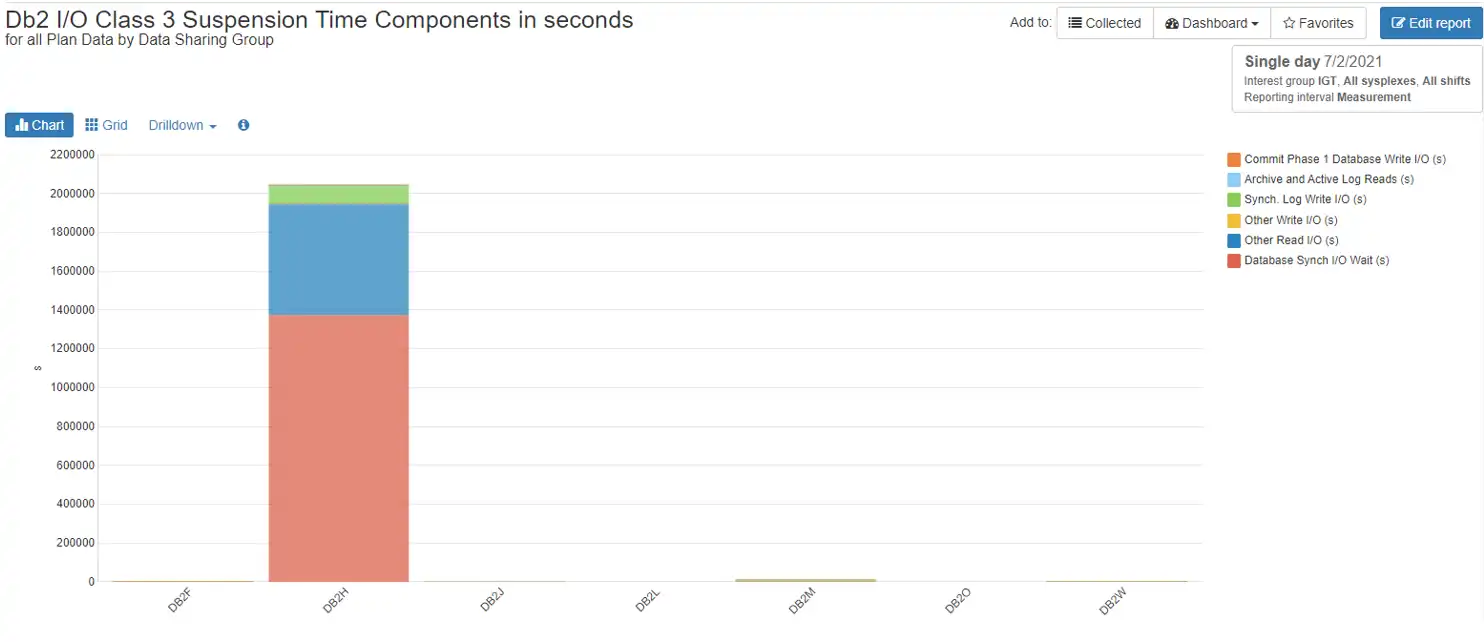
Figure 3: Db2 I/O Class 3 Suspension Time Components in Total Seconds
Other categories for I/O wait include Commit Phase 1 Database Write I/O, Archive and Active Log Reads, Sync Log Writes, and Other Read and Write I/Os.
To improve database I/O wait time, inspect buffer pool performance.
The most important metrics for buffer pool performance are:
- Total Read I/O Rate: the number of times Db2 must actually go out to Disk to retrieve a needed page
- Page Residency Time: how long pages reside in the buffer pool and therefore may not have to be re-read from disk
- Random Hit Ratio: the percentage of time Db2 finds a random page in the buffer pool.
If these numbers are becoming increasingly worse over time, there may be a database object that could benefit from a reorg, or a package that should be rebound after a tablespace or index reorg and runstats have been run.
If there is log I/O wait time, solving that problem should involve tuning the output buffer (OUTBUFF), archiving to disk, and making sure there is no device contention.
Lock Wait Times
In order to ensure data concurrency and data consistency, Db2 takes locks and latches on objects, and of course these locks and latches can contend with each other and cause wait times. In data sharing environments there is even more complexity as many locks must be propagated to the coupling facility so as to be communicated to other group members.
The chart below shows our DB2H data sharing group as having fairly low suspension times for locks per commit, with the largest portion attributable to global contention in the coupling facility for child l-locks.
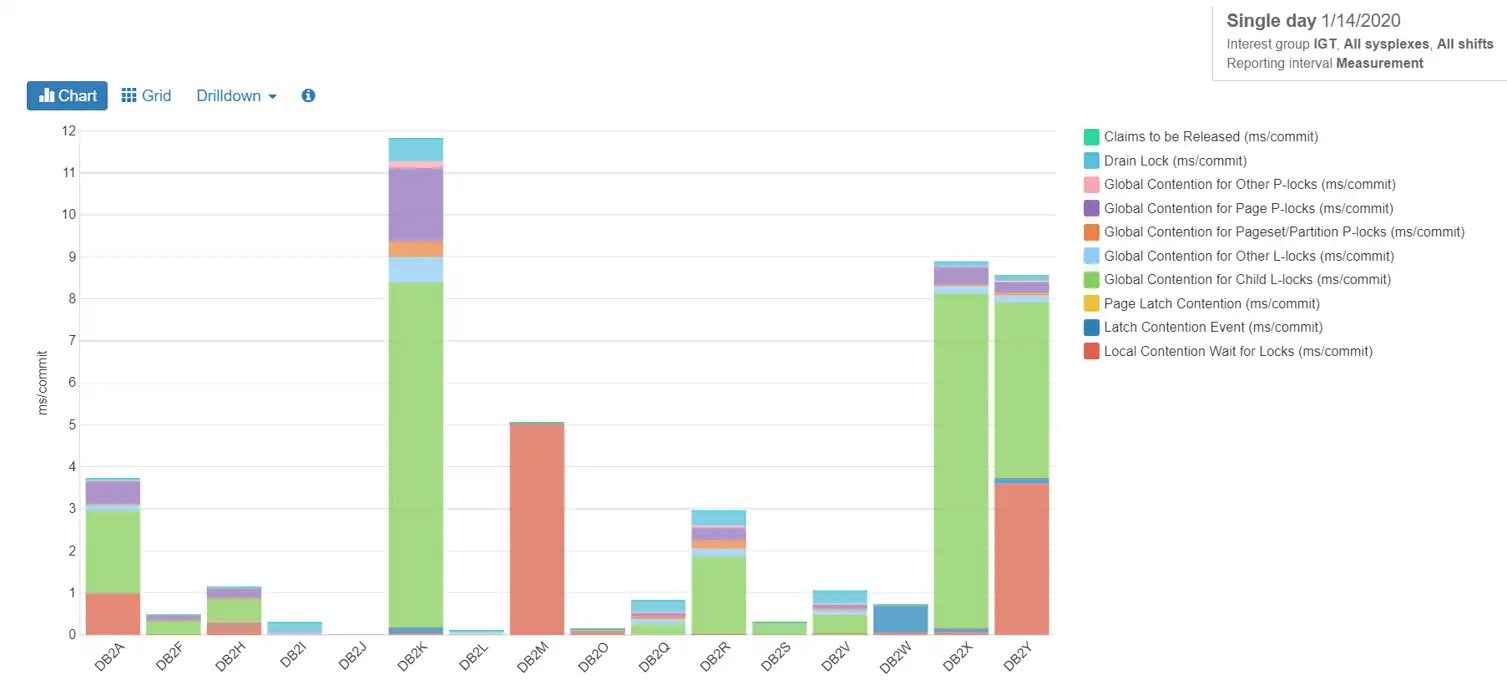
Figure 4: Lock Waits ms/commit
Changing the measurements from ms/commit to total ms, as we did with total suspensions above, we can see in Figure 5, however, that the relative total suspension time for the day is negligible. so obviously waiting for locks is not an issue for this data sharing group. The same is true for our DB2W group.
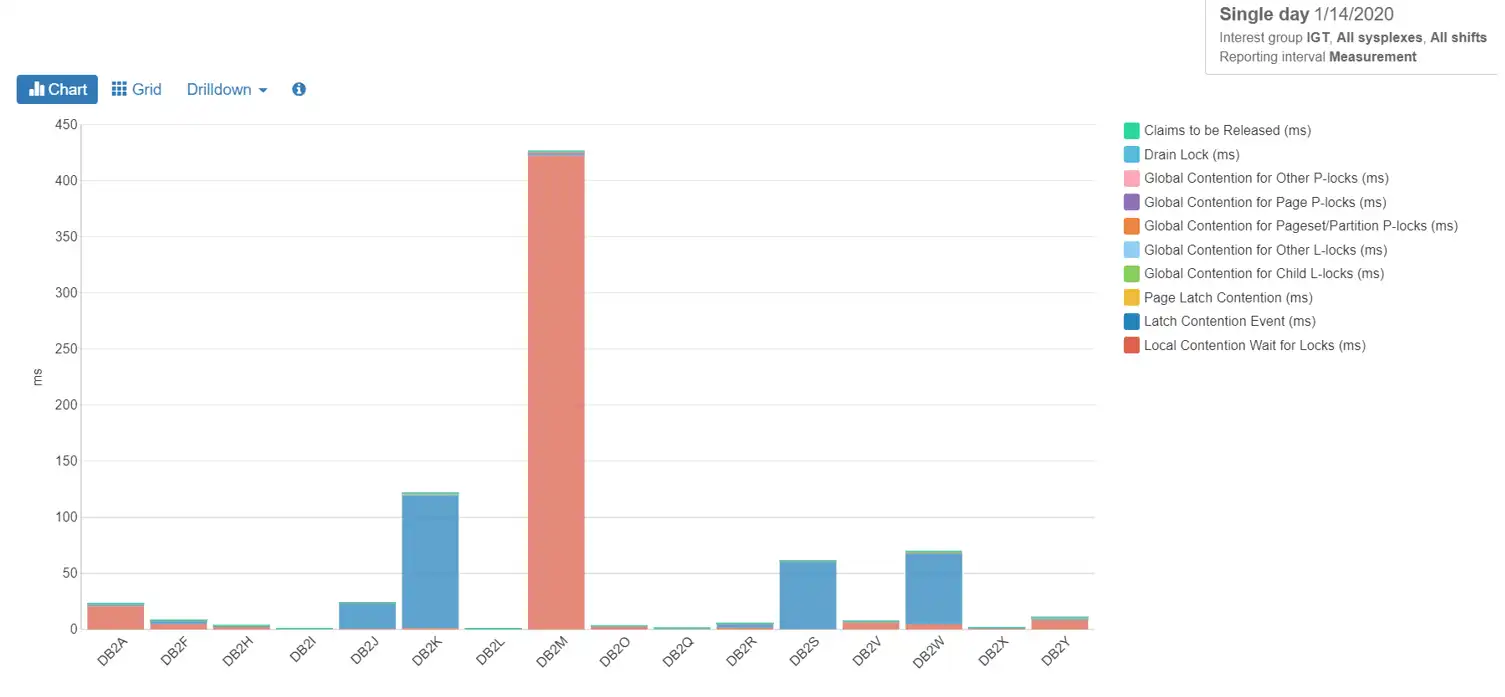
Figure 5: Lock Waits in Total ms
What happened in DB2M? We can’t know for sure until more research can be done on the type of workload being run there. The waits are mostly for local locks, so it is probable that data sharing is involved very little. Looking into what applications were running concurrently might give us an idea of why these lock contentions are occurring.
Not Accounted Time
Just as it sounds, ‘Not Accounted Time’ is time that Db2 cannot account for. It is outside the bounds of what Db2 can sense. It generally involves waiting for CPU or time in the network. Other reporting methods, such as RMF reports, can be beneficial in determining the cause of not accounted time.
Other Waits
There are many miscellaneous wait times, such as those relating to data set open, close, extend, delete, and define. If your DSMAX is frequently being reached so that datasets are constantly having to be reopened, consider raising the value of DSMAX.
Alternatively, important or frequently-used datasets could be set to CLOSE NO. If extending, deleting, and defining become a problem, increasing the primary allocation of those pagesets could solve that issue.
When a pageset is opened for update, the SYSLGRNX directory table is updated to reflect it. When the pageset is no longer involved in update processing, there is another update. Sometimes there is wait time for this activity. If there is a high amount of suspension time in this category, the values of PCLOSET and PCLOSEN should be set to reduce the amount of pseudo-closing of datasets that is occurring, as well as using CLOSE YES on most of the database objects.
Tuning Db2 Wait Times for Cost Savings
The evaluation of suspension times is crucial to keeping a Db2 subsystem running smoothly and efficiently.
By understanding a few methods to identify and tune performance problems, great improvements can be made, which translate into great cost savings. This makes everyone happy – from users to application developers, to systems administrators, all the way to higher-level management.
There are many additional waits than those covered in this blog, that your performance analytics tool, such as IntelliMagic Vision, may help you detail and investigate. As with SMF data, there is always more to be found! Reach out to me if you have any questions about what I covered in this blog, or if you are curious about the other waits not covered.
This article's author
 Sally Mir
 Share this blog
You May Also Be Interested In:
What's New with IntelliMagic Vision for z/OS? 2024.2
February 26, 2024 | This month we've introduced changes to the presentation of Db2, CICS, and MQ variables from rates to counts, updates to Key Processor Configuration, and the inclusion of new report sets for CICS Transaction Event Counts.
What's New with IntelliMagic Vision for z/OS? 2024.1
January 29, 2024 | This month we've introduced updates to the Subsystem Topology Viewer, new Long-term MSU/MIPS Reporting, updates to ZPARM settings and Average Line Configurations, as well as updates to TCP/IP Communications reports.
Making Sense of the Many I/O Count Fields in SMF | Cheryl Watson's Tuning Letter
In this reprint from Cheryl Watson’s Tuning Letter, Todd Havekost addresses a question about the different fields in SMF records having different values.
Book a Demo or Connect With an Expert
Discuss your technical or sales-related questions with our mainframe experts today