
Leveraging Familiarity of Solution
I’ll be watching my grandkids closely this Summer as they jump in our backyard pool. The older ones have the confidence to jump off the diving board because they have learned to swim on their own and have been in the pool a few times. However, the younger ones are still approaching the whole experience with some real caution. I’m thankful for that. The main difference for them is experience-based confidence. This is a bit like performance analysts when we are approached with analysis of problems that may be outside our expertise or comfort zone.
A z/OS systems performance person has a high level understanding of the CICS, MQ, and Db2 subsystems, but when asked to find the root cause in something that looks like a Db2 delay, you may feel uncomfortable performing a deep dive into unfamiliar waters.
Fortunately, when recently asked by a customer during our monthly status update to look at a specific time frame to identify the culprit of a recent Db2 slowdown, I wasn’t afraid to take the dive because I had access to super powerful ‘performance goggles.’ There was only 5 minutes left in the call, and it was related to a subsystem, Db2, that I’m familiar with, but by no means an expert.
First Step: Approach the Problem
The questions: When, How long, What, …. were quickly answered by the customer as it related to the issue. Equipped with a couple of answers, an adhoc report is just a few clicks away with a modern Db2 performance solution.
Db2 has one of the most voluminous sets of SMF data available for z/OS subsystems. For most of our customers, it is easily equal to all of the other SMF data combined. Some Db2 customers generate one terabyte/day of compressed data.
The big split between statistics (SMF 100) and accounting (SMF 101) data gives two primary dimensions in which to focus your analysis. Starting down a statistics path first, visual cues of expert-selected metrics and thoughtful sets of reports (thumbnails) with subtitles helped me quickly navigate through the details.
I had a hunch that the description fit a potential lock wait or something along those lines. By the way, I don’t think I could define a latch wait from a lock wait accurately, but a wait is a delay, and I was interested in delays.
Choosing the IntelliMagic health insights report for locking and latching (seen in Figure 1) first helped focus the diagnosis since the customer representatives provided the additional benefit of seeing the visual cues with a screen share.
When a list of 20 data sharing groups showed up for a particular time frame, I could immediately focus on two or three hot spots, noted by the red exception bubbles, which aligned with the details provided. With solutions that only have a tabular view to review the data, it’s easy to miss something that should be standing out.
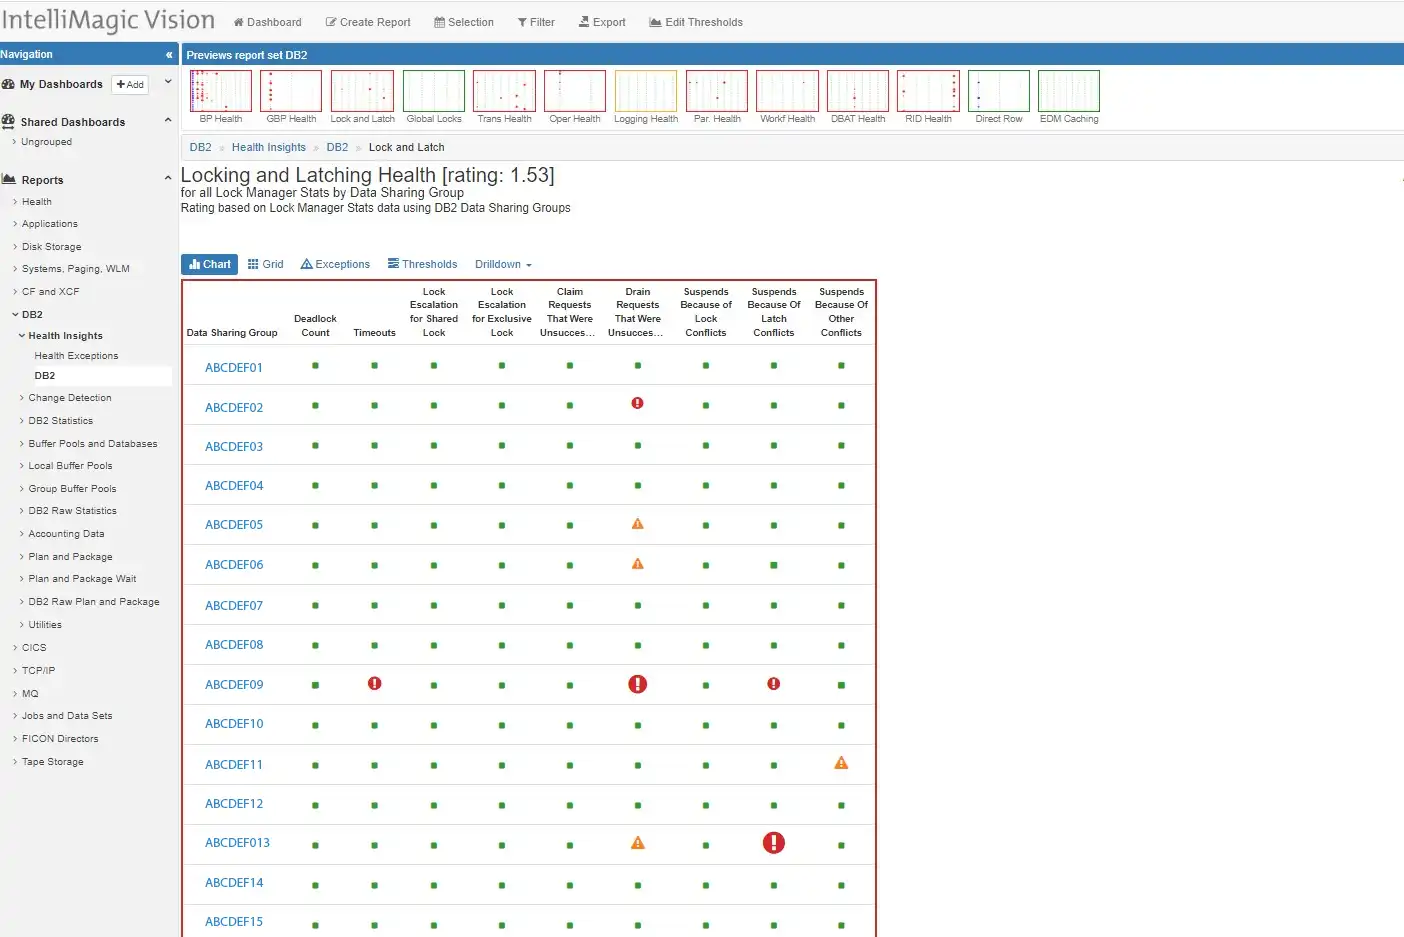
Figure 1: Finding the best path for quick analysis
Selecting drilling down into time frames, Sysplex, Systems, and further details, I was able to quickly focus the analysis from hundreds of options down to just a few. The highest rated Db2 infrastructure metric showed some stress for one particular data sharing group in the latch conflict suspends.
Both members of the data sharing group were impacted. Since we had little time left in the call, it was important to take a quick look at the details from the database application side, so I poked into the Db2 accounting data reports.
Application Orientation of Response Delays
Db2 accounting data has a number of dimensions to dive into. The statistics had me focused on latch suspends, so I chose to start with some Db2 transaction response times and compare them to last week. Again, the flexibility to navigate and control output greatly simplified the activity so that we could remain focused on what might be the cause of the delay.
The view that kept us on track showed a precipitous drop in the commit rate, and at the same time a heavy spike in response time. A 10-fold increase in a 15-minute average, at the time in question.
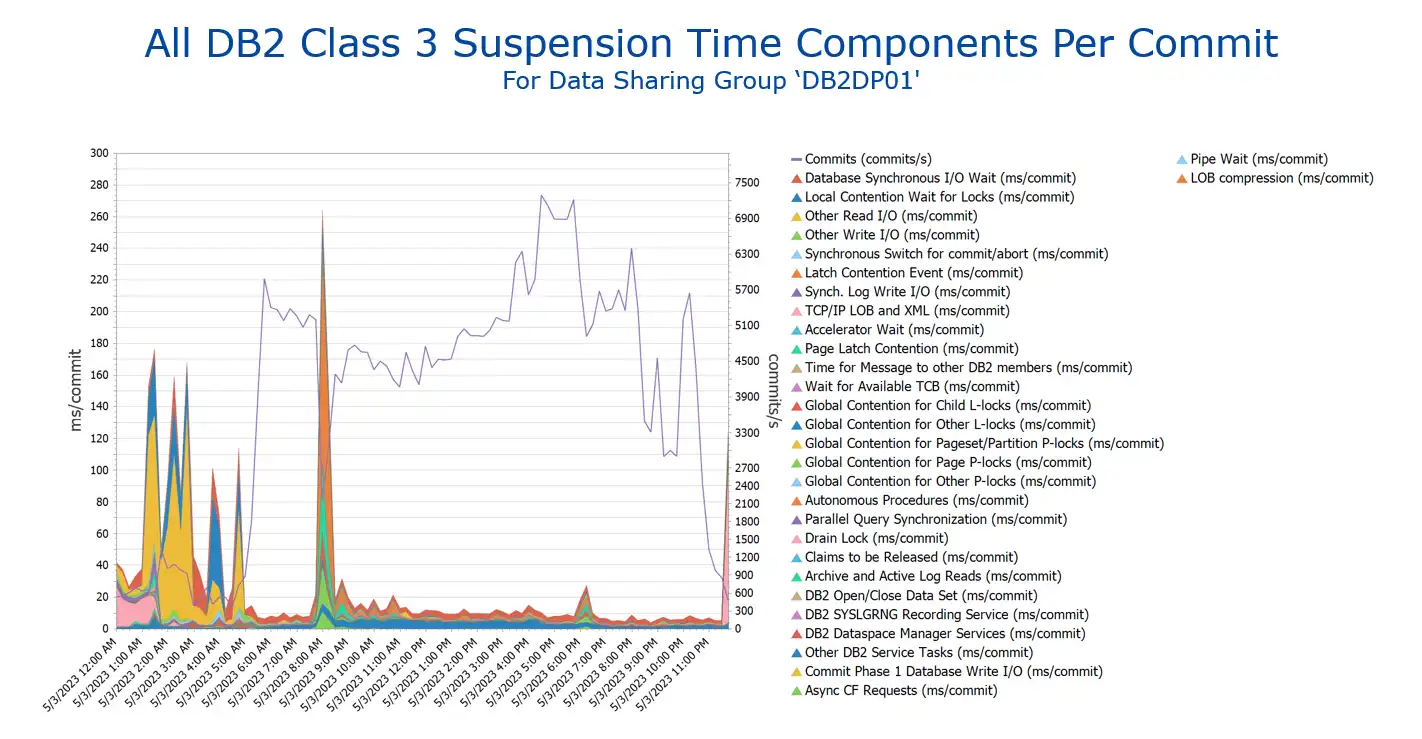
Figure 2: Commit Rate drops & Db2 Suspension times skyrocket
This was looking promising, so by having automatic options to drill into the last bit of details (and there are many) we could see that the latch contention – Data Sharing Index Split was the primary cause of delay (suspension) during the spike.
Quick navigation and easy to choose options helped me provide the customer quick identification of a major contributor to a problem that had already consumed many hours of time and analysis. Links to the reports and a short email after the call gave the customer some real evidence of delay causes to the post-mortem call that was happening in minutes.
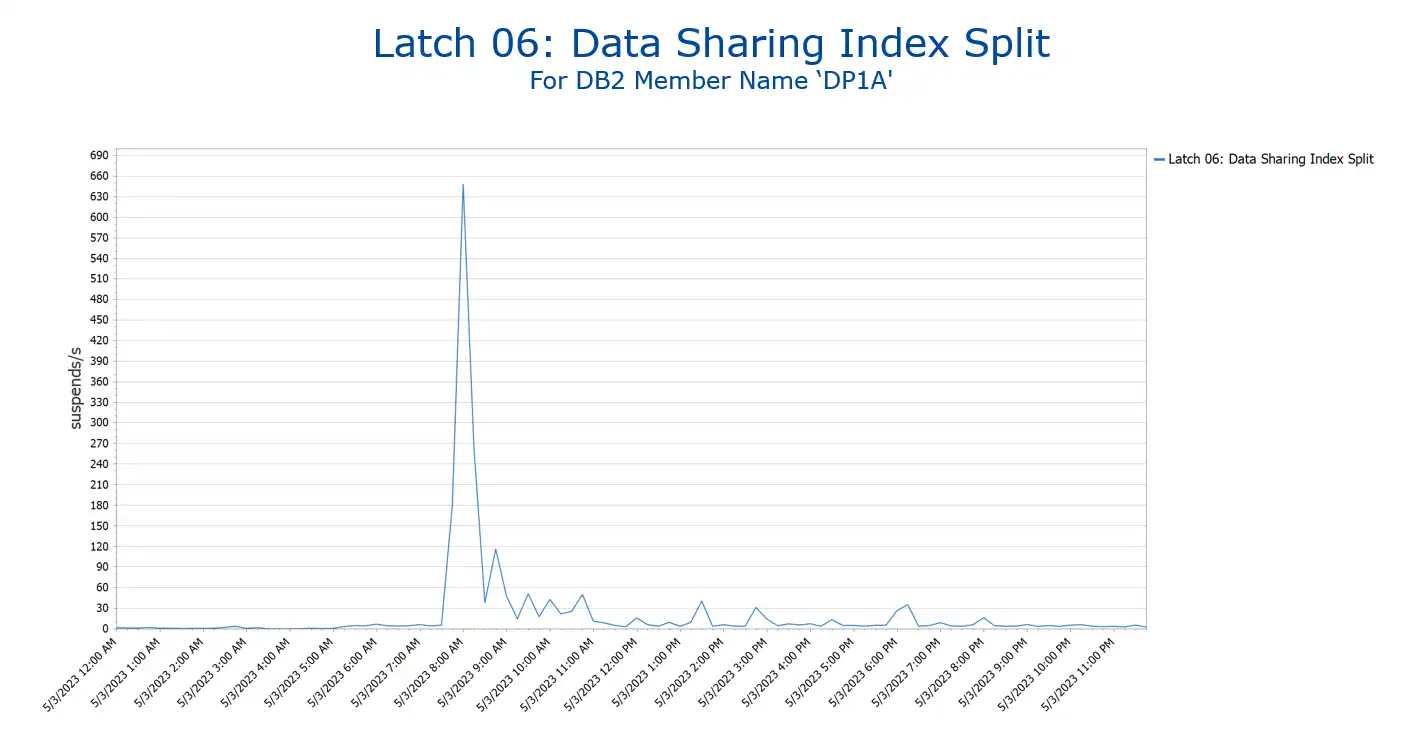
Figure 3: Honing in on the Primary Issue
Simplicity Searching the Complex
The complexity of Db2 normally requires serious experience to understand the details when looking into delays. However, having experience with an intuitive and intelligent analysis solution significantly improves the productivity of your analysis by offering good starting points, helpful filtering options, and easy navigation.
There are over 20 categories for Db2 class 3 suspend time; there are approximately 30 different categories of latch suspend time. Visualizing many of these together in one tabular report can quickly become overwhelming.
Solutions that provide separate reporting in thumbnails that can be quickly scanned visually (such as IntelliMagic Vision) are much more efficient. Good solutions make the investigation process easier, more approachable, and more productive for your team. This also provides more satisfying work for those doing the analysis.
I much prefer getting to a point where I can do research on what the index split latch suspend means than creating and combing through thousands of tabular reports looking for variances.
So… What is an Index Page Split?
Robert Catterall (IBM) has a nice blog on a very similar issue. He is a Db2 performance expert. If you are experiencing some of these types of suspends in your environment, he also has some recommendations on actions you could take. Quoting directly from his blog here:
“An index page split occurs when Db2 has to insert an entry in an index page because of an insert (or an update of an indexed column) and that page is full. In that situation, a portion of the entries in the page will be moved to what had been an empty page in the index, so that there will be room in the formerly-full page for the new entry. What does Db2 data sharing have to do with this (and in the environment about which I’m writing, Db2 is running in data sharing mode)? In a data sharing system (versus a standalone Db2 subsystem), an index page split action has a greater impact on throughput because it forces a log-write operation.”
The logical next step actions take a bit more space than we have here, and since Robert has already outlined them well in his blog, I would refer to that if you need to investigate further.
Experiential Learning
A familiar toolset encourages one to explore. This is true in all kinds of things but is also true for performance analysis. While I’m not close to being a Db2 expert, my familiarity with a flexible solution that is easy to navigate has enabled me to learn and explore other subsystems within the z/OS infrastructure much more quickly and seamlessly. This encourages me to deepen my understanding of less familiar subsystems within z/OS and helps me become more skilled in these areas.
Rather than using my time to develop expertise in a subsystem specific solution, I can invest that time in reading more details about complex subsystem infrastructure details that drive performance. This is a great way to stay fresh and focused on the next challenge that arises.
This article's author
 Jack Opgenorth
 Share this blog
You May Also Be Interested In:
What's New with IntelliMagic Vision for z/OS? 2024.2
February 26, 2024 | This month we've introduced changes to the presentation of Db2, CICS, and MQ variables from rates to counts, updates to Key Processor Configuration, and the inclusion of new report sets for CICS Transaction Event Counts.
Viewing Connections Between CICS Regions, Db2 Data Sharing Groups, and MQ Queue Managers
This blog emphasizes the importance of understanding connections in mainframe management, specifically focusing on CICS, Db2, and MQ.
What's New with IntelliMagic Vision for z/OS? 2024.1
January 29, 2024 | This month we've introduced updates to the Subsystem Topology Viewer, new Long-term MSU/MIPS Reporting, updates to ZPARM settings and Average Line Configurations, as well as updates to TCP/IP Communications reports.
Book a Demo or Connect With an Expert
Discuss your technical or sales-related questions with our mainframe experts today