
The article, “Thirty years of DNA forensics: How DNA has revolutionized criminal investigations” captures the fascinating story from 1987 of the first person to be apprehended for committing murder by leveraging DNA technology. It goes on to say that “DNA profiling has become the gold standard in forensic science since that first case 30 years ago.” As indicated in the article title, DNA is a great example of how leveraging insights provided by data can inform and indeed “revolutionize” an entire discipline. Managing Db2 availability and optimizing Db2 performance are also areas that have the potential to be lifted to new levels of effectiveness by leveraging insights provided by SMF data.
This blog will highlight the value that can be derived from buffer pool statistics at the dataset level provided by IFCID 199, particularly when enriched through integration with SMF 42 dataset I/O performance data. This “dynamic duo” provides extensive insights into I/O activity and response time data at the Db2 buffer pool and database levels. A potential enhancement to buffer pool tuning methodologies available through this integration will also be explored.
Introduction to IFCID 199 Data
By way of context, buffer pool performance and metrics receive a great deal of attention within Db2 because the extent to which getpage requests can be satisfied with data already residing in a buffer (through various prefetch mechanisms) plays a major role in Db2 performance and efficiency. Buffer pool hits avoid I/Os that are synchronous with the unit of work (“sync I/Os”) and thus introduce delays into response times. These hits also improve efficiency since accessing data from memory consumes far less CPU than issuing an I/O to request it from disk.
IBM describes IFCID 199 as “buffer pool statistics at the dataset level,” but generating this data creates some metrics you might not expect to fall within the scope of “buffer pool statistics,” including I/O counts and delays for both synchronous and asynchronous activity. Figure 1 is an example of average synchronous I/O delay to the most active databases. Other ways this data could be viewed include by buffer pool and buffer pool type (e.g., data or index, GBP-dependent or non-GBP-dependent).
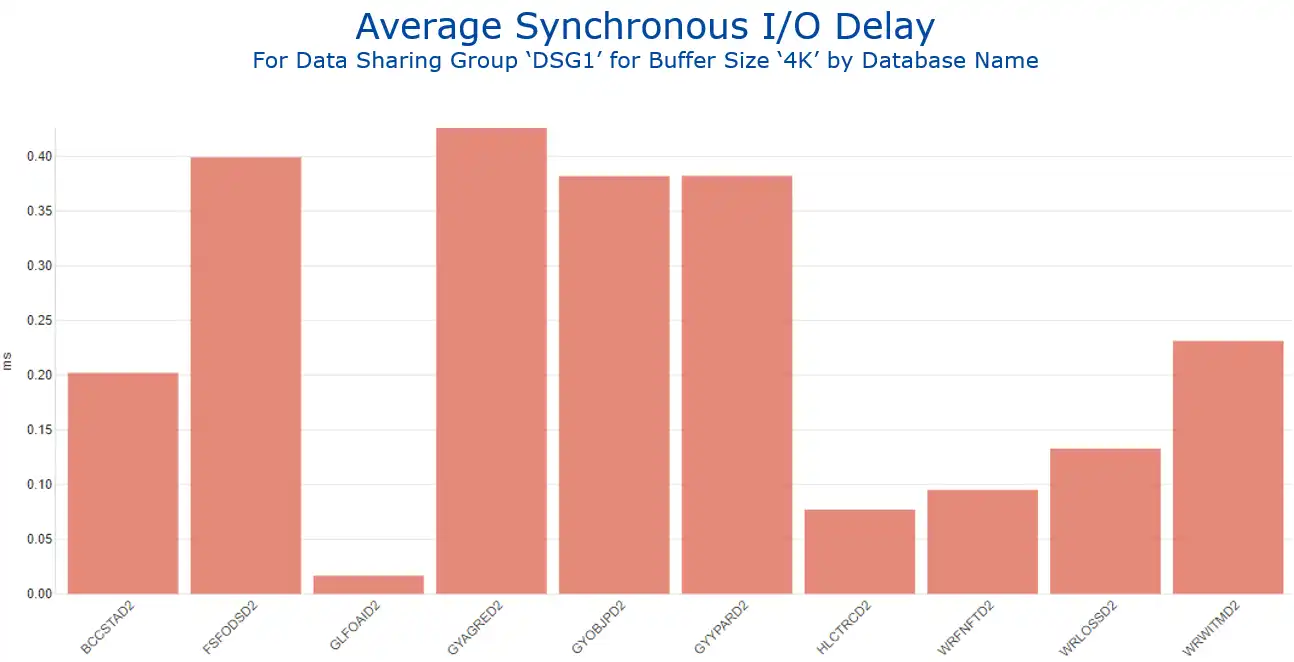 Figure 1: IntelliMagic Vision Report Showing Average Synchronous I/O Delay by Database
I/O performance metrics at the dataset level are provided in SMF 42.6 records. These metrics include data access type (e.g., sequential, random), cache profile (hit or miss), and disk response times.
There are many benefits of integrating this data with Db2 metrics at the dataset level (IFCID 199). When a getpage cannot be satisfied from a buffer causing a sync read I/O, this linkage provides visibility into the performance characteristics of that I/O at the database and buffer pool levels.
Figure 2 provides a database level view of the disk response times of those read I/Os, broken into the traditional response time components of IOSQ, pend, disconnect, and connect. This view selected the databases with the highest I/O rates.
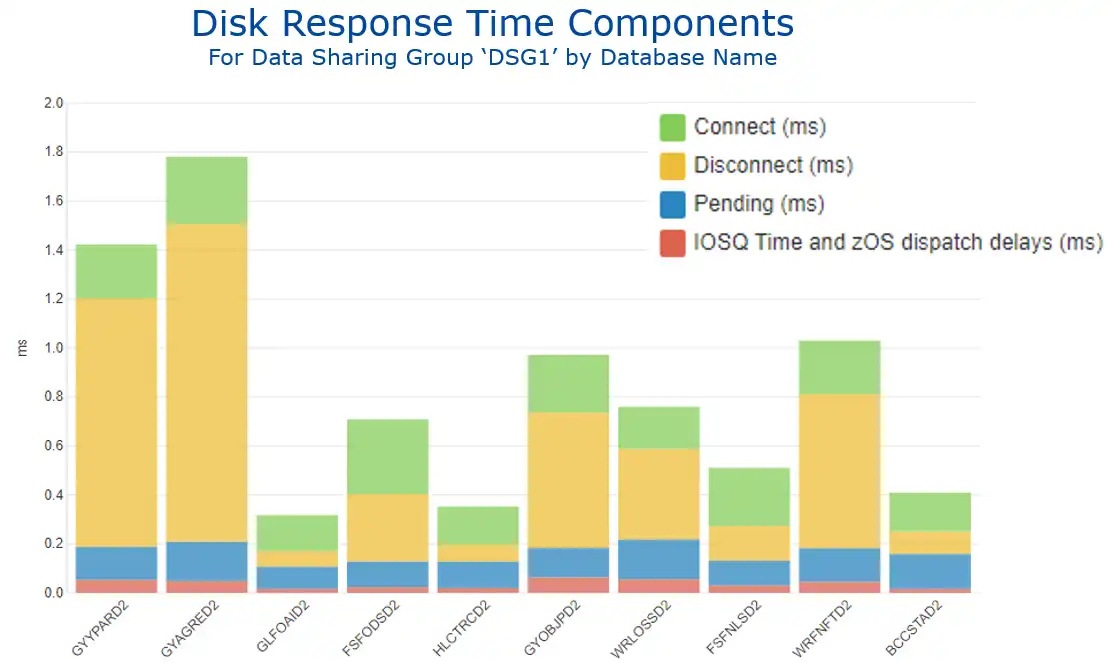 Figure 2: Disk Response Time Components by Database
Drilling down from here to view the response time for the busiest database across the selection interval (Figure 3) indicates that the response time is much higher during the day shift, and that disconnect time is the primary contributor to overall disk response time. This report has also been customized to add I/O rate on the secondary axis (light blue line) to enable analysis of any potential correlation.
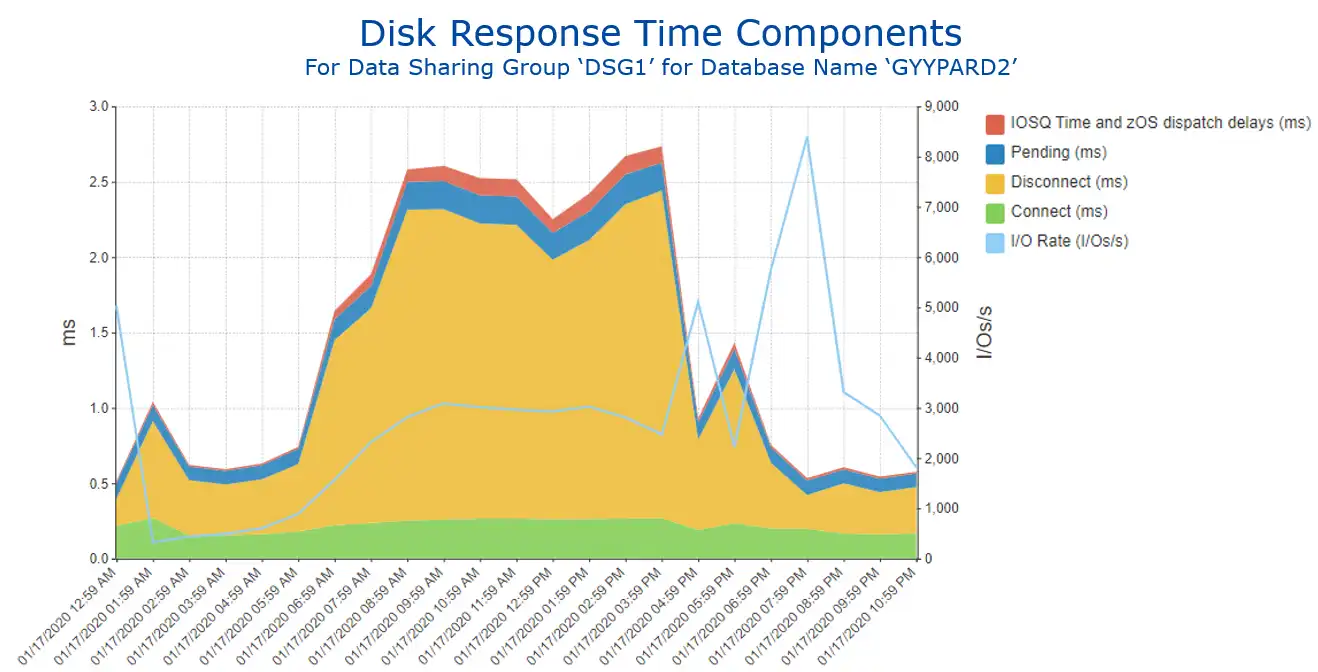 Figure 3: Disk Response Time Components for Selected Database
Exploring this disconnect time across the members of the data sharing group (DSG), as seen in Figure 4 (available as a single step from the previous view through a report customization dialog), yields a possibly unexpected finding. In most cases in this environment the DSG members exhibit very similar behavior, but here the disconnect time is much higher on a single member (DBH5 in light blue), suggesting that some unique activity may be occurring on that member which may warrant additional analysis.
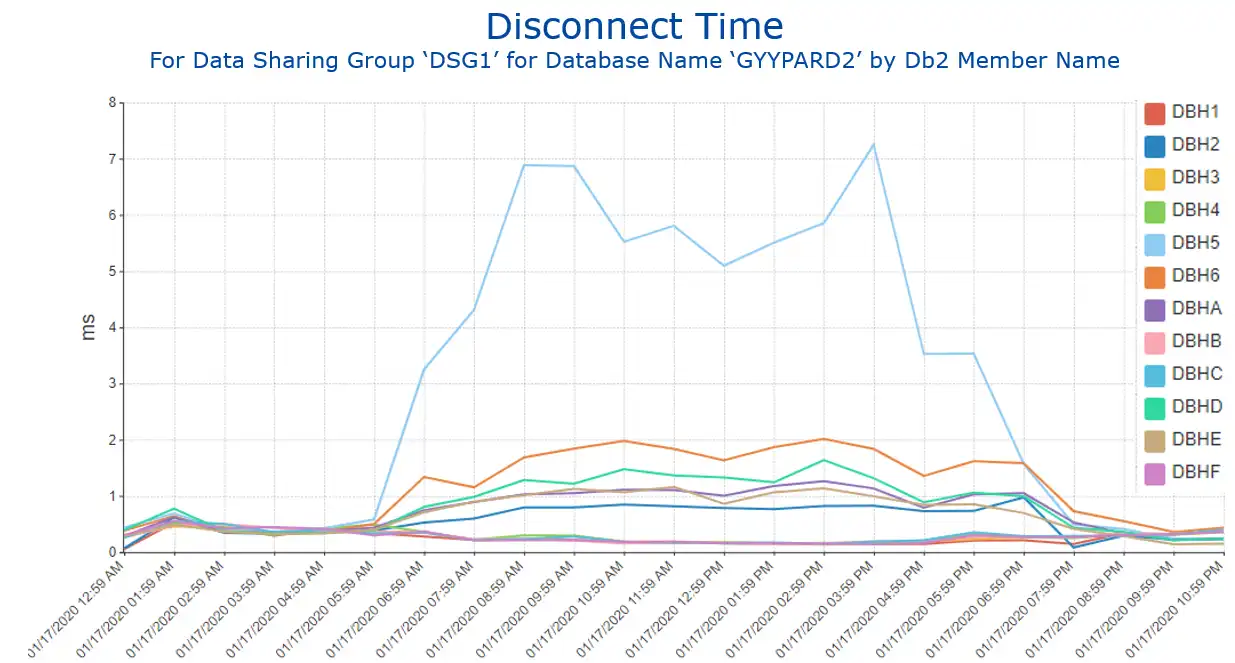 Figure 4: Disconnect Time for Selected Database by Db2 Member Name
Integration with SMF 42 Dataset Performance Data – Cache Hits and Misses
Another valuable insight provided from the SMF 42 data is the cache behavior of the I/Os, shown in Figure 5 by buffer pool (again also available by database). We will come back and revisit this cache metric toward the end of the blog and consider its potential relevance for buffer pool tuning.
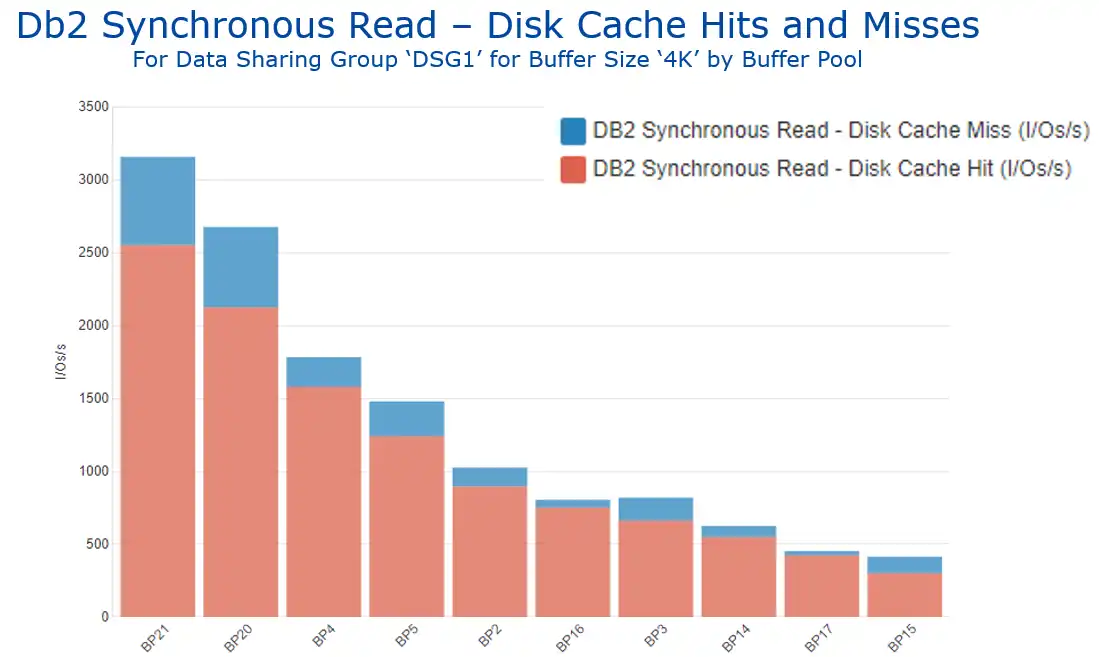 Figure 5: Db2 Synchronous Read – Disk Cache Hits and Misses by Buffer Pool
“Getpage Efficiency”
Another powerful way to leverage this integration of the Db2 IFCID 199 and SMF 42 data is visibility into what we might call “getpage visibility.”
Figure 6 shows getpage efficiency for the databases with the highest getpage activity, reflecting the three possible outcomes when a getpage requests data:
- The getpage is resolved with a buffer pool hit (in red), the ideal situation.
- It results in an I/O, but the I/O is resolved with a disk cache hit (in yellow).
- The least desirable outcome, satisfying the getpage requires an actual disk I/O (in blue).
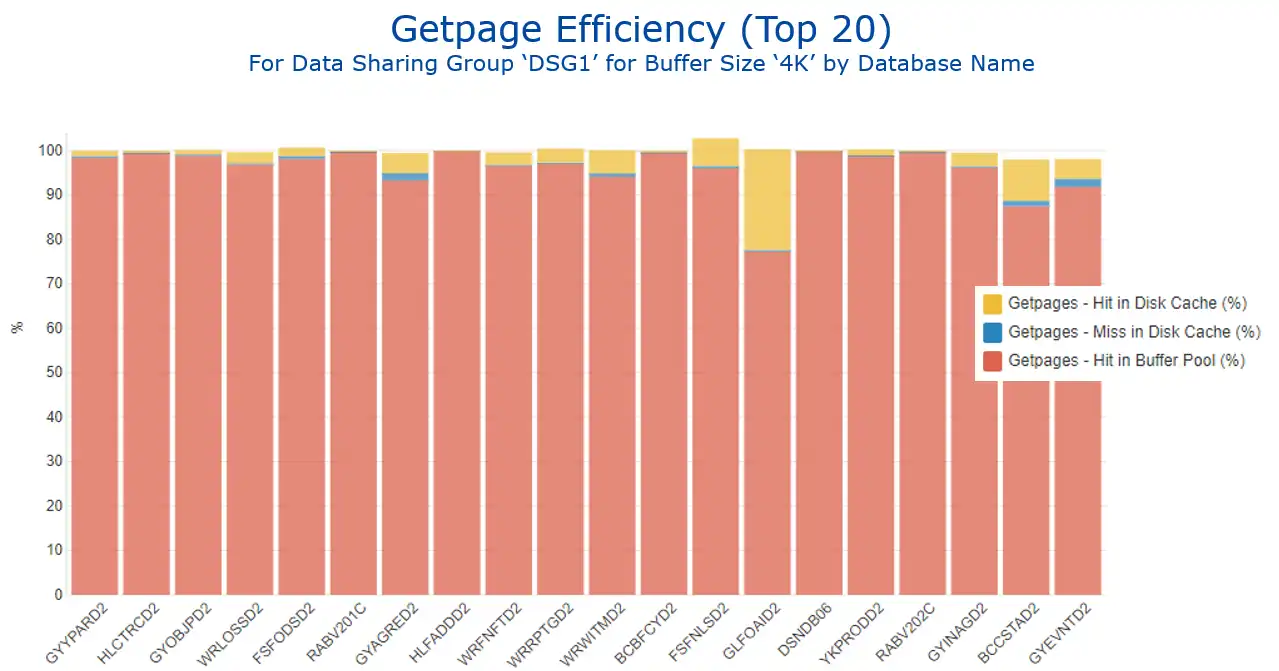 Figure 6: Getpage Efficiency by Database
Leveraging Cache Hit Data to Enhance Buffer Pool Tuning Methodology
Figure 7 presents getpage efficiency by buffer pool and gets us thinking about how this data can be leveraged to enhance a buffer pool tuning methodology. In my previous blog, “z/OS Memory and Db2 – A Match Made in Heaven,” I walked through a methodology advocated by one Db2 expert and showed how easily accessible data can help streamline buffer pool tuning exercises.
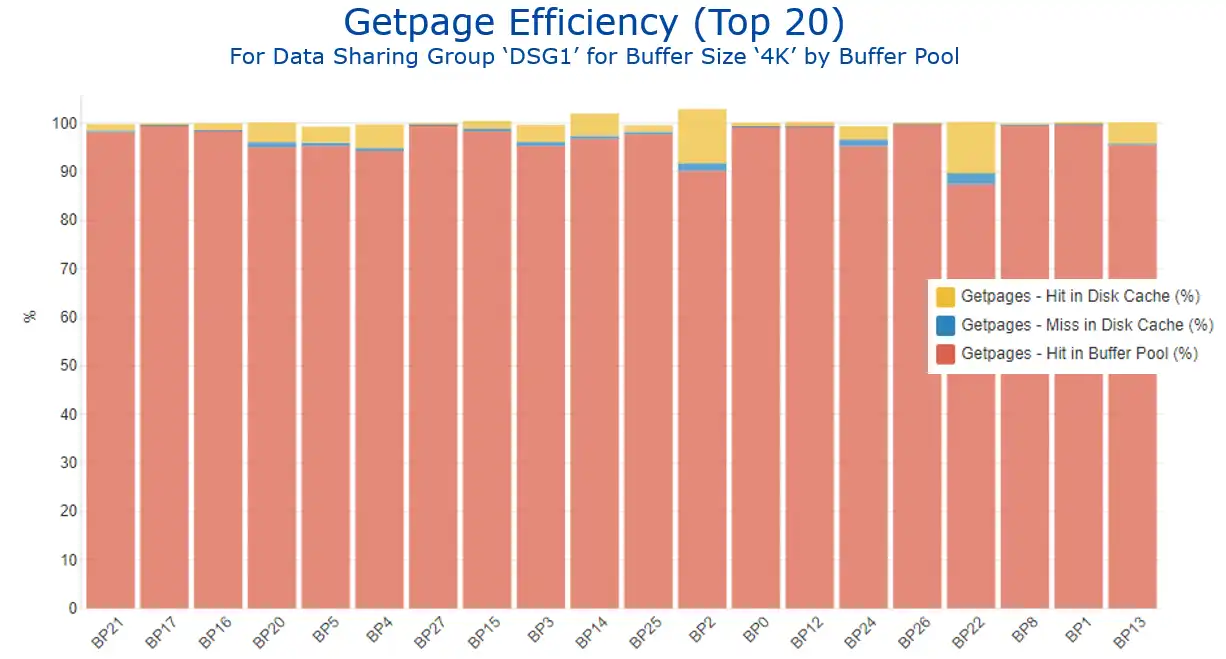 Figure 7: Getpage Efficiency by Buffer Pool
The potential application of this data to inform a buffer pool tuning methodology is this: disk cache hits are an indication of a “second tier” of access. The page did not reside in the Db2 buffer pool long enough to be accessed there, but it was accessed “soon enough” thereafter such that it was still present in the disk cache. So, cache hit volumes (as shown in Figure 8) can be an indicator of buffer pools that would particularly benefit from being enlarged. (Many thanks to a customer who suggested this idea to me.)
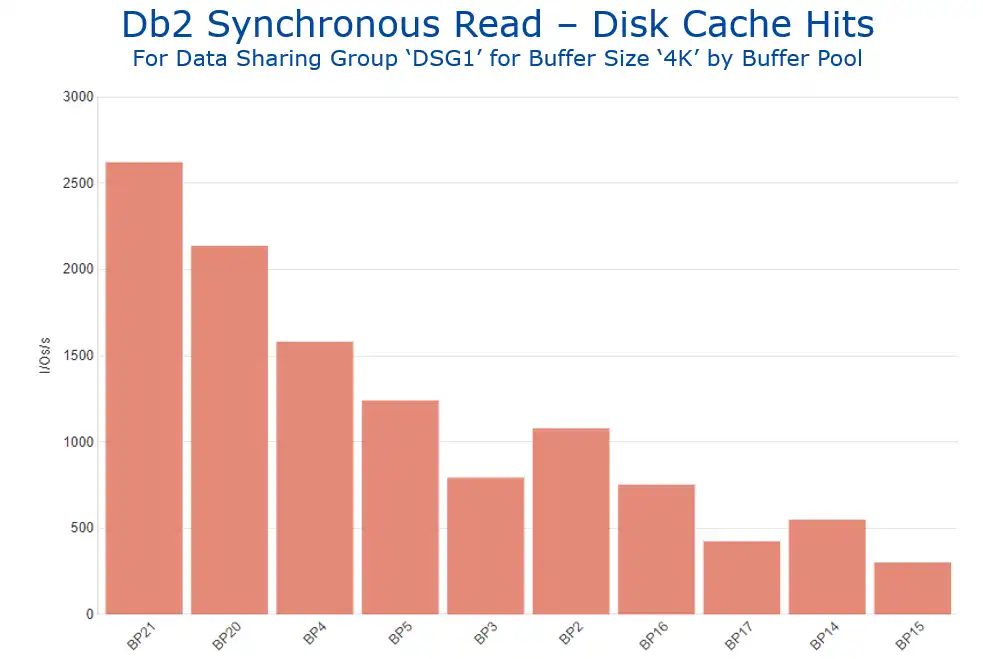 Figure 8: Db2 Synchronous Read – Disk Cache Hits by Buffer Pool
There may be scenarios where elapsed time improvements or CPU reductions are of more value to your organization during selected times of the day. For example, you may seek to improve transaction response times particularly for intervals with peak online volumes. Or you may want to focus your CPU reduction initiatives to intervals when monthly peak 4HRAs typically occur. Cases like those suggest limiting the previous view to the time periods of interest, or alternatively utilizing a time-of-day view (as seen in Figure 9).
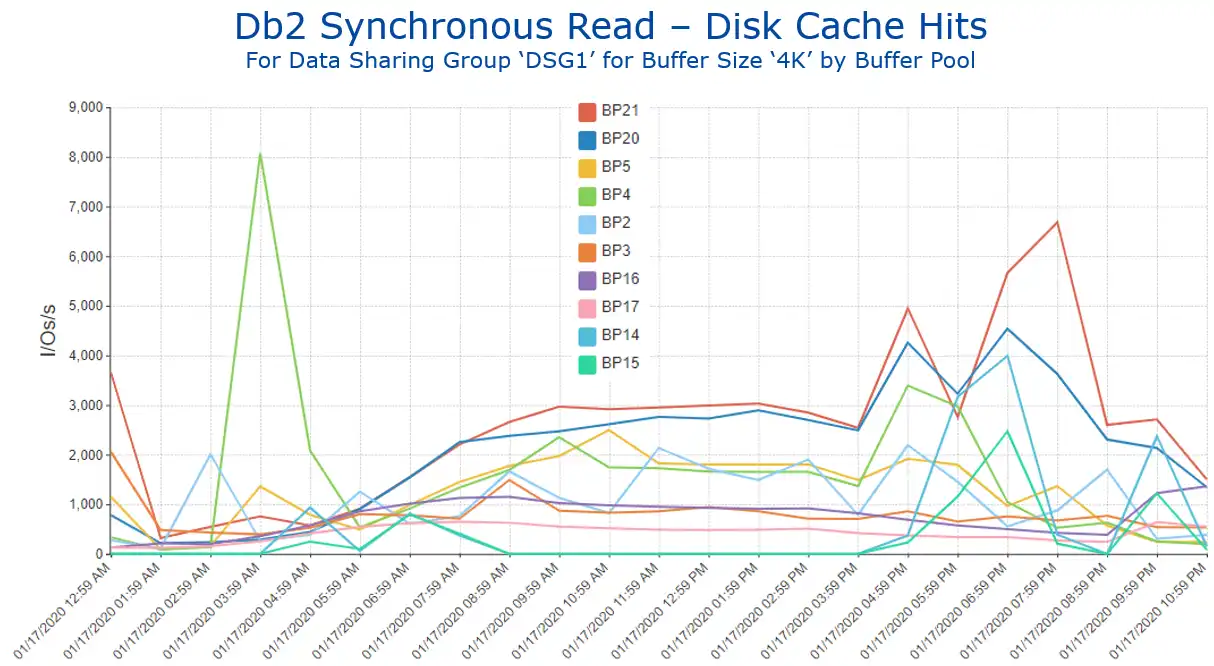 Figure 9: Db2 Synchronous Read – Disk Cache Hits by Buffer Pool
Accessible Metrics Enable Continuous Improvement
Easily accessible data streamlines buffer pool tuning exercises or any analysis. One approach to simplifying the ability to revisit the analysis is to collect all the pertinent views in a customized dashboard, as illustrated in Figure 10 with the charts from this blog. This enables collaborative participation and/or additional analysis pursuing a new approach, focus, and drill downs. Also, the analysis can be quickly updated for a new time period by updating the selection intervals on the reports.
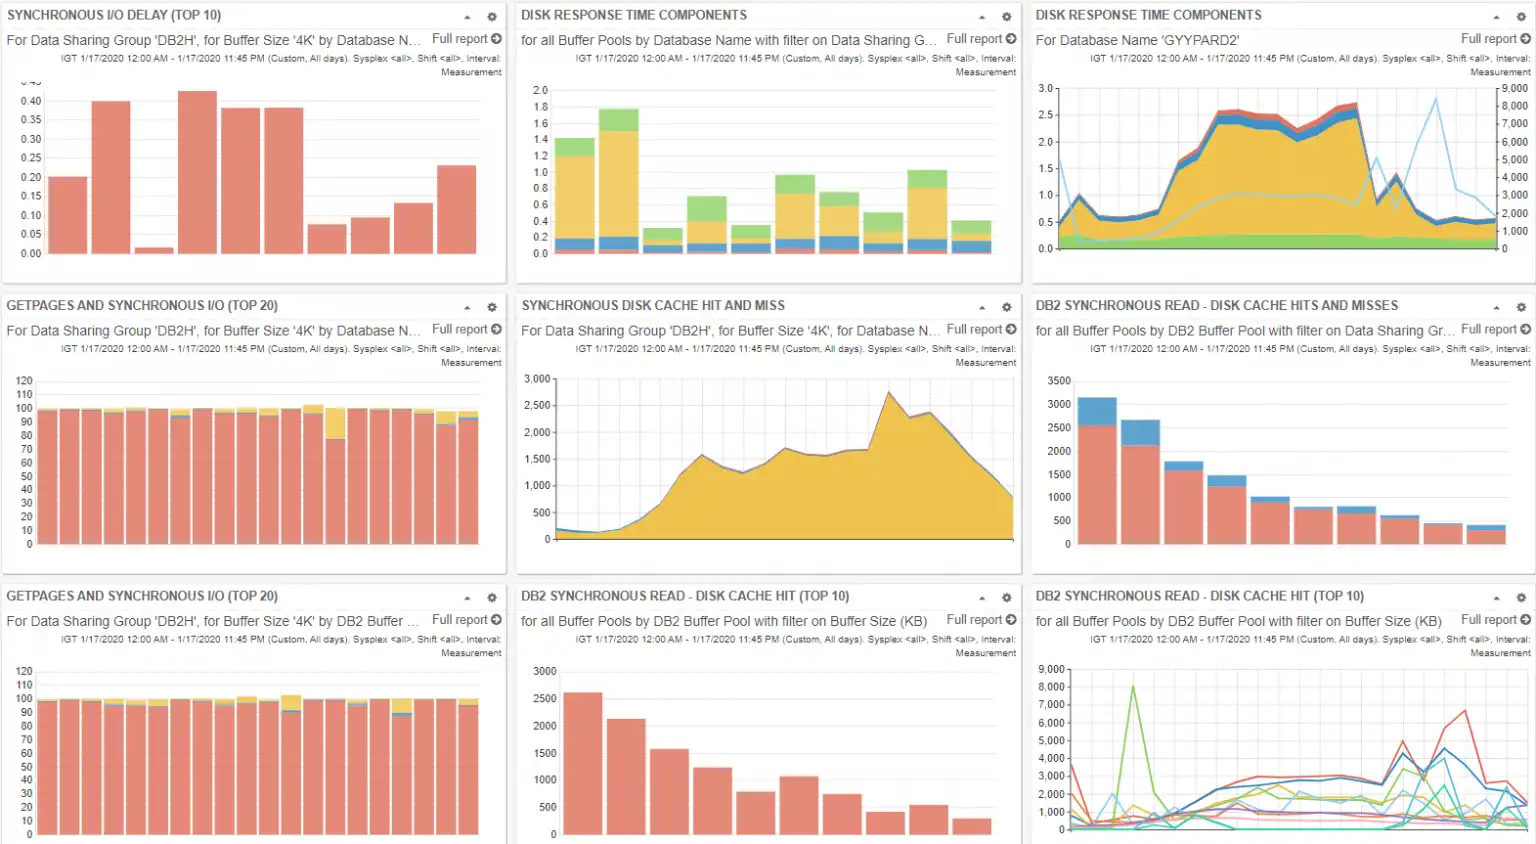 Figure 10: DB2 IFCID 199 Dashboard
The following video shows the navigation involved in creating these views (and others) to help better understand the value integrating IFCID 199 and SMF 42 data can provide.
- “Integrating Db2 IFCID 199 with SMF 42 Data” – 6 minutes
Has Your SMF Data Analysis Been Revolutionized?
Advances in DNA analysis over the past 30 years have greatly advanced the ability of criminal investigators to identify who was present at a crime scene and increase the likelihood they can reconstruct what really happened. The title of the article did not overstate the case – DNA has indeed revolutionized criminal investigations.
SMF data is a potentially rich source enabling performance analysts on the z/OS platform to manage and optimize their operating environments. Db2 provides particularly rich metrics, such as buffer pool statistics at the dataset level provided by IFCID 199 data. Great additional value can be derived for Db2 performance analysts when this data is integrated with dataset I/O performance data as found in SMF 42 records, which was the primary focus of this blog. The potential value of leveraging buffer pool-level cache hit data to enrich buffer pool tuning methodologies was also introduced.
There have also been great advances over the past 30 years enabling performance analysts to unlock more of the potential value of their SMF data, in areas such as intuitive visibility, context sensitive drill downs, dynamic report customization, customized shared dashboards, automated assessments of key metrics, and integration between multiple sources of SMF data. Are you operating in the “pre-DNA” or “post-DNA” era of SMF data analysis?
This article's author
 Todd Havekost
 Share this blog
You May Also Be Interested In:
What's New with IntelliMagic Vision for z/OS? 2024.2
February 26, 2024 | This month we've introduced changes to the presentation of Db2, CICS, and MQ variables from rates to counts, updates to Key Processor Configuration, and the inclusion of new report sets for CICS Transaction Event Counts.
What's New with IntelliMagic Vision for z/OS? 2024.1
January 29, 2024 | This month we've introduced updates to the Subsystem Topology Viewer, new Long-term MSU/MIPS Reporting, updates to ZPARM settings and Average Line Configurations, as well as updates to TCP/IP Communications reports.
Making Sense of the Many I/O Count Fields in SMF | Cheryl Watson's Tuning Letter
In this reprint from Cheryl Watson’s Tuning Letter, Todd Havekost addresses a question about the different fields in SMF records having different values.
Book a Demo or Connect With an Expert
Discuss your technical or sales-related questions with our mainframe experts today