Insights into Peak 4HRA Data in SCRT with IntelliMagic Vision
IntelliMagic Vision provides visibility into peak 4HRA data far beyond what is provided by IBM’s Sub-Capacity Reporting Tool (SCRT) to enable you to reduce MLC expense.
View the following video for an example of that visibility.

Reduce 4HRA / R4HA Without Impacting Application Performance
IBM’s Monthly License Charge (MLC) expenses are driven by the monthly peak 4HRA. Managing those peaks and having insights into the CPU consumption during peak intervals as reflected in the 4-Hour Rolling Average (or Rolling 4-Hour Average) is crucial to reducing software expense without impacting application performance.
IntelliMagic Vision provides visibility into 4HRA MSU values for the highest 20 intervals by product by billing month for both CMP and CEC-based environments, with direct drilldowns into CPU consumption during those peak intervals.
The integration here of Usage (SMF 89) and address space (SMF 30) data shows which address spaces are registering which products, supporting several significant use cases.
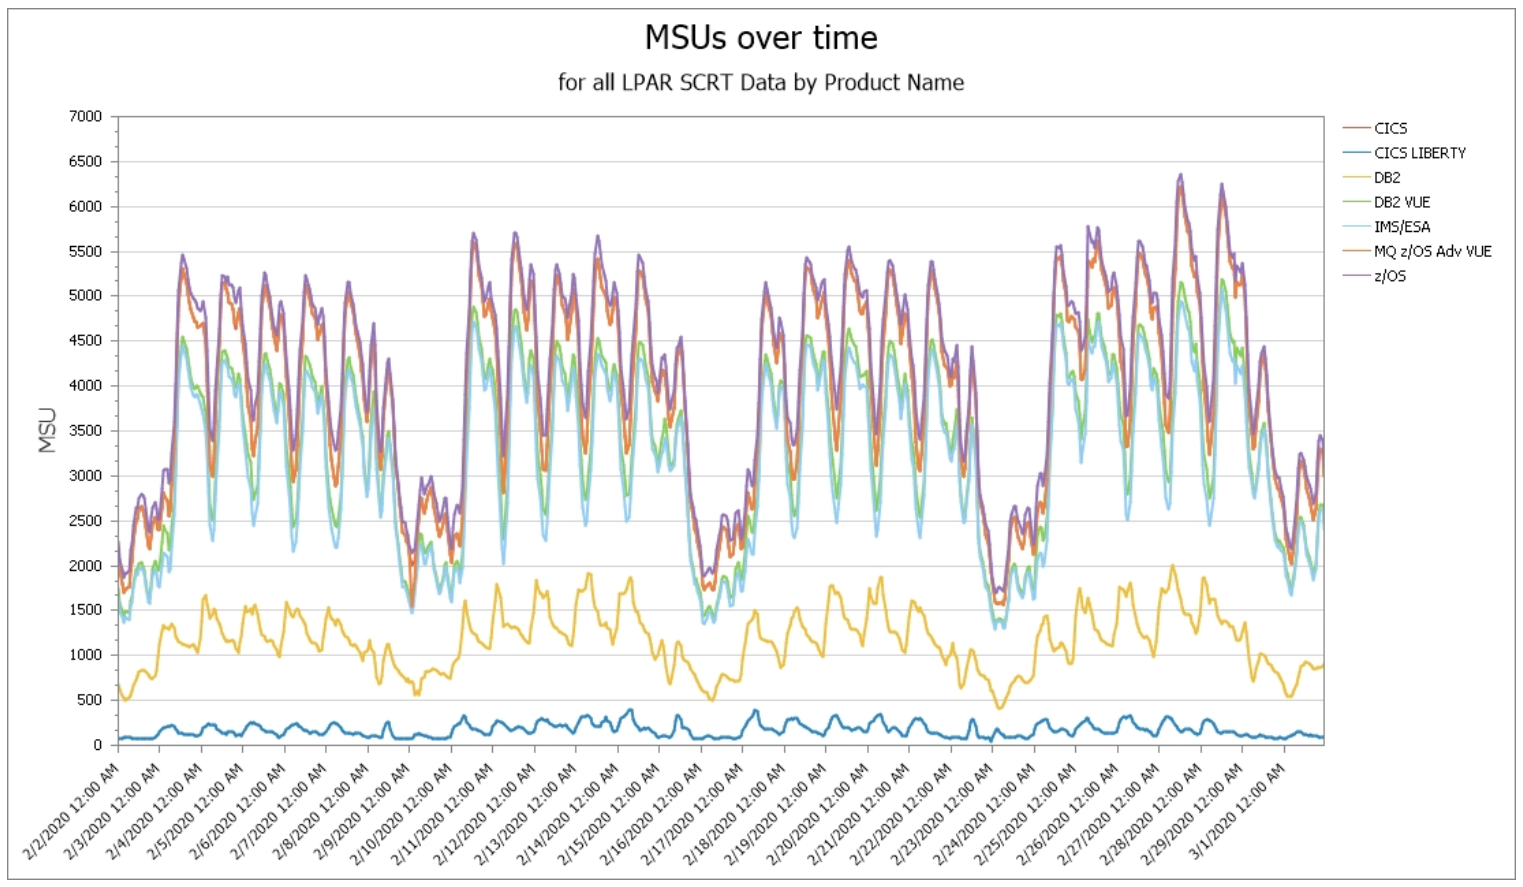
MSUs over Time
This graphical view displays SCRT MSU values by product over the selected time interval, which will commonly be a billing month. From this view several data items that aid SCRT analysis are immediately apparent, including monthly peak values by product, when they occurred, how much higher the peak was than other time intervals, and the relative relationships between MSU consumption of different products.
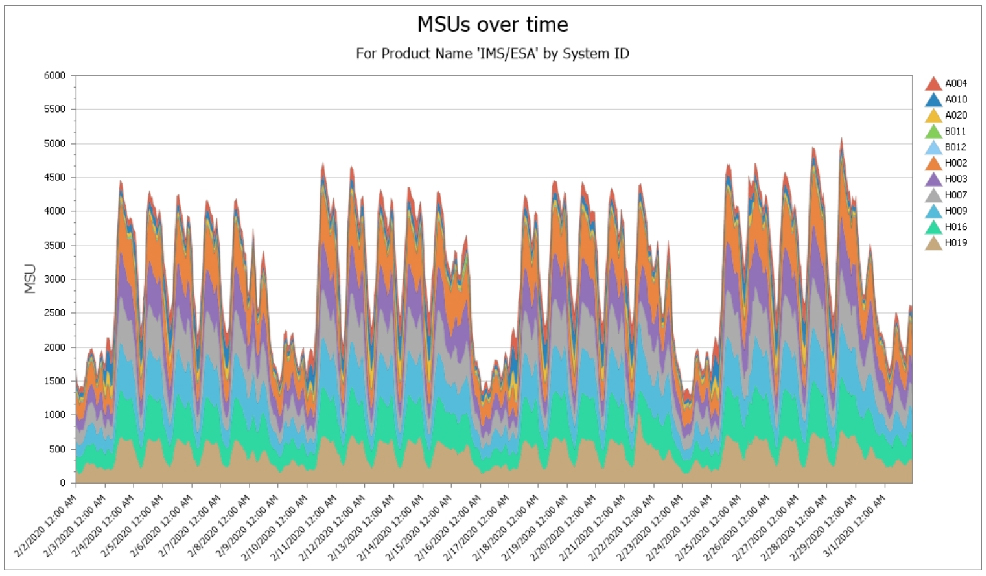
Drilldown to MSUs by System
From the “MSUs Over Time” view several drilldowns are available to examine the MSU contributions for that product of subsets of the infrastructure, including by CEC, by LPAR, and by system (shown here). Usage data is referenced to report only on systems where the selected product was executing.
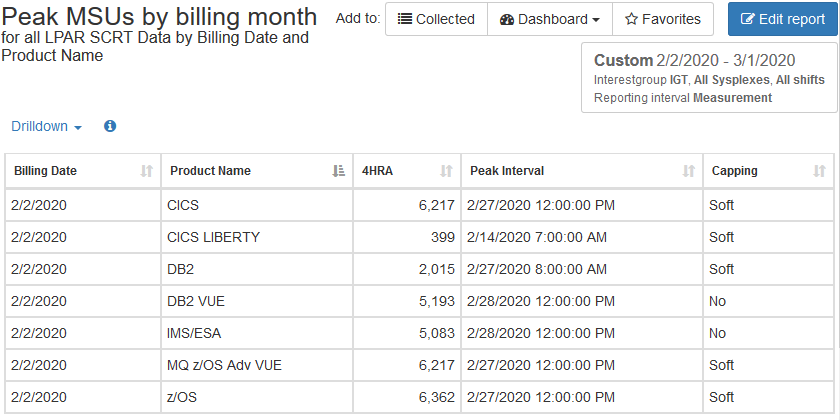
Peak MSUs (table)
The previously described information is also available in a tabular format. In addition to the peak MSU consumption for the billing month, this initial view also identifies the interval when the peak occurred, and whether soft or group capping was in effect during that peak interval.
There are separate tables reflecting the distinct values for Country Multiplex Pricing (CMP), shown here, and legacy SCRT with separate peak intervals by CEC.
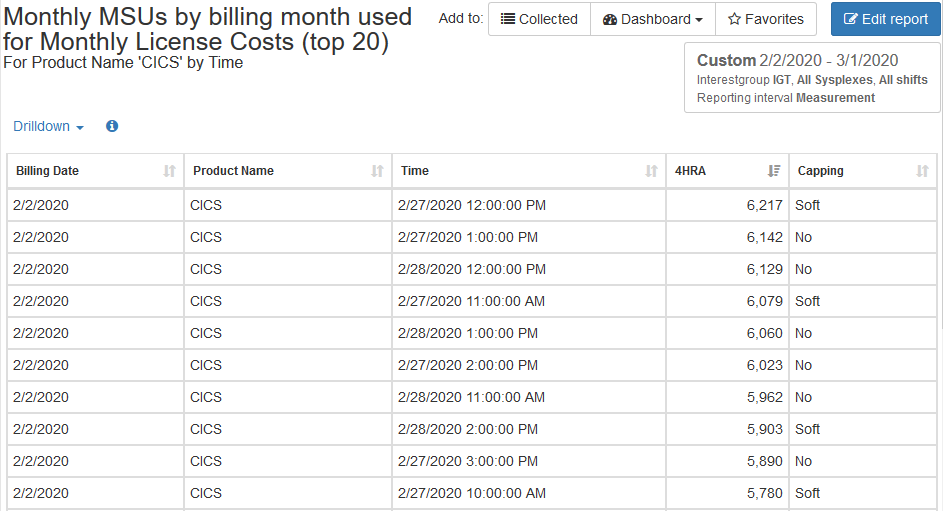
Top 20 Intervals (excerpt)
The drilldowns available from the SCRT tables include this display of the top 20 intervals, enabling analysis of how much higher the peak was than the next highest intervals during the month.
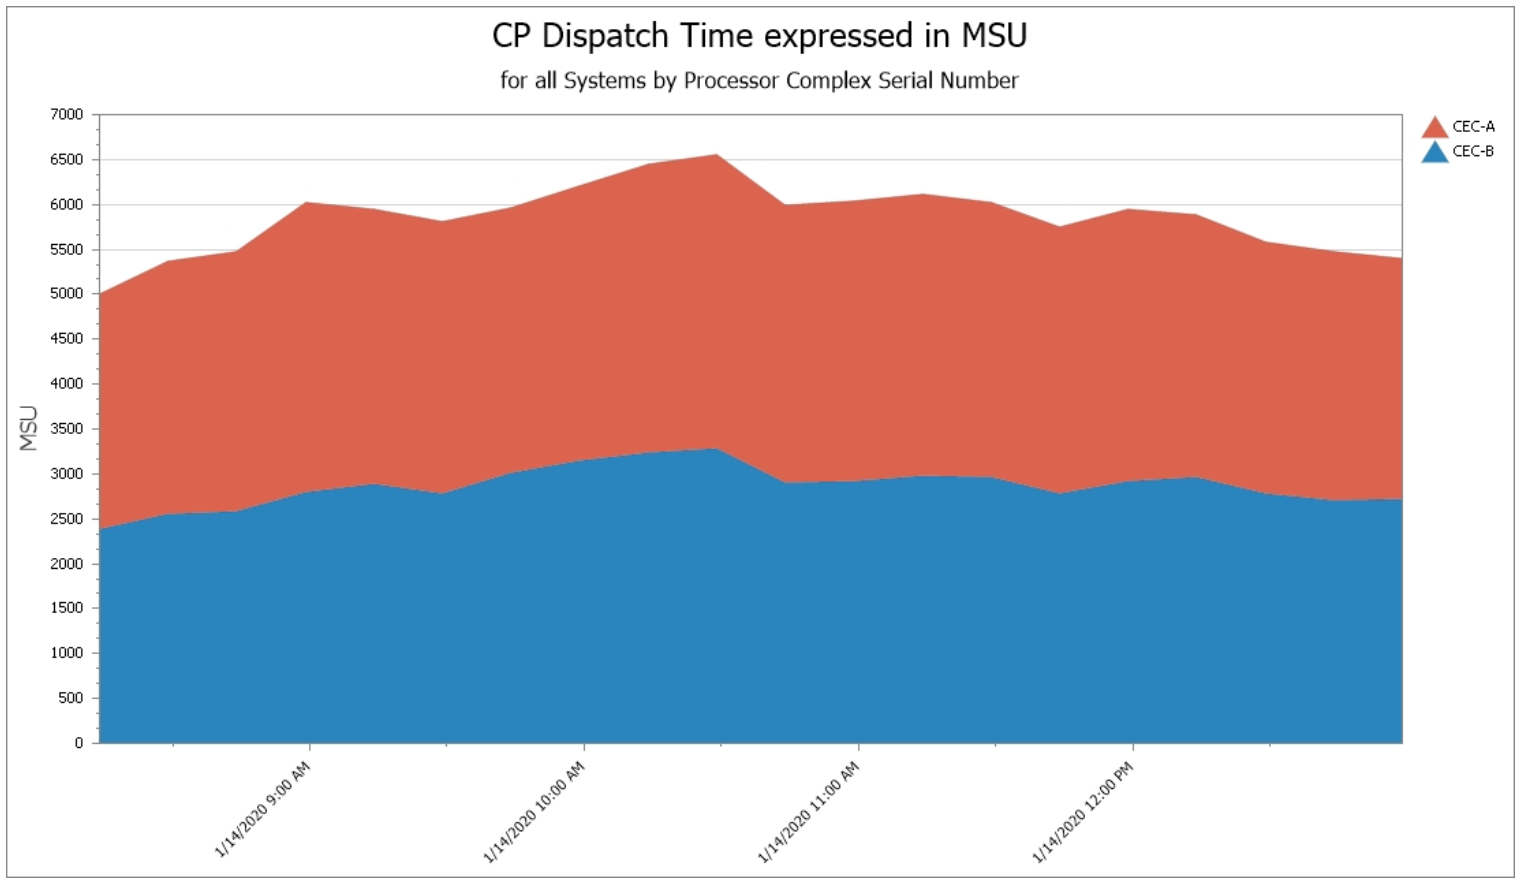
CPU Use during Peak 4HRA Interval
One common line of inquiry for SCRT analysis is to understand the workload that was executing during the peak interval, so that any opportunities to reschedule work outside of non-peak intervals can be identified. From the graphical view the “MSUs at Time” drilldown takes you directly into a view of the CPU consumption during the selected 4-hour interval. From there all the powerful CPU analysis capabilities of IntelliMagic Vision are available, to further drilldown by system, by workload, by WLM importance level, by service class, by report class, and ultimately by address space.
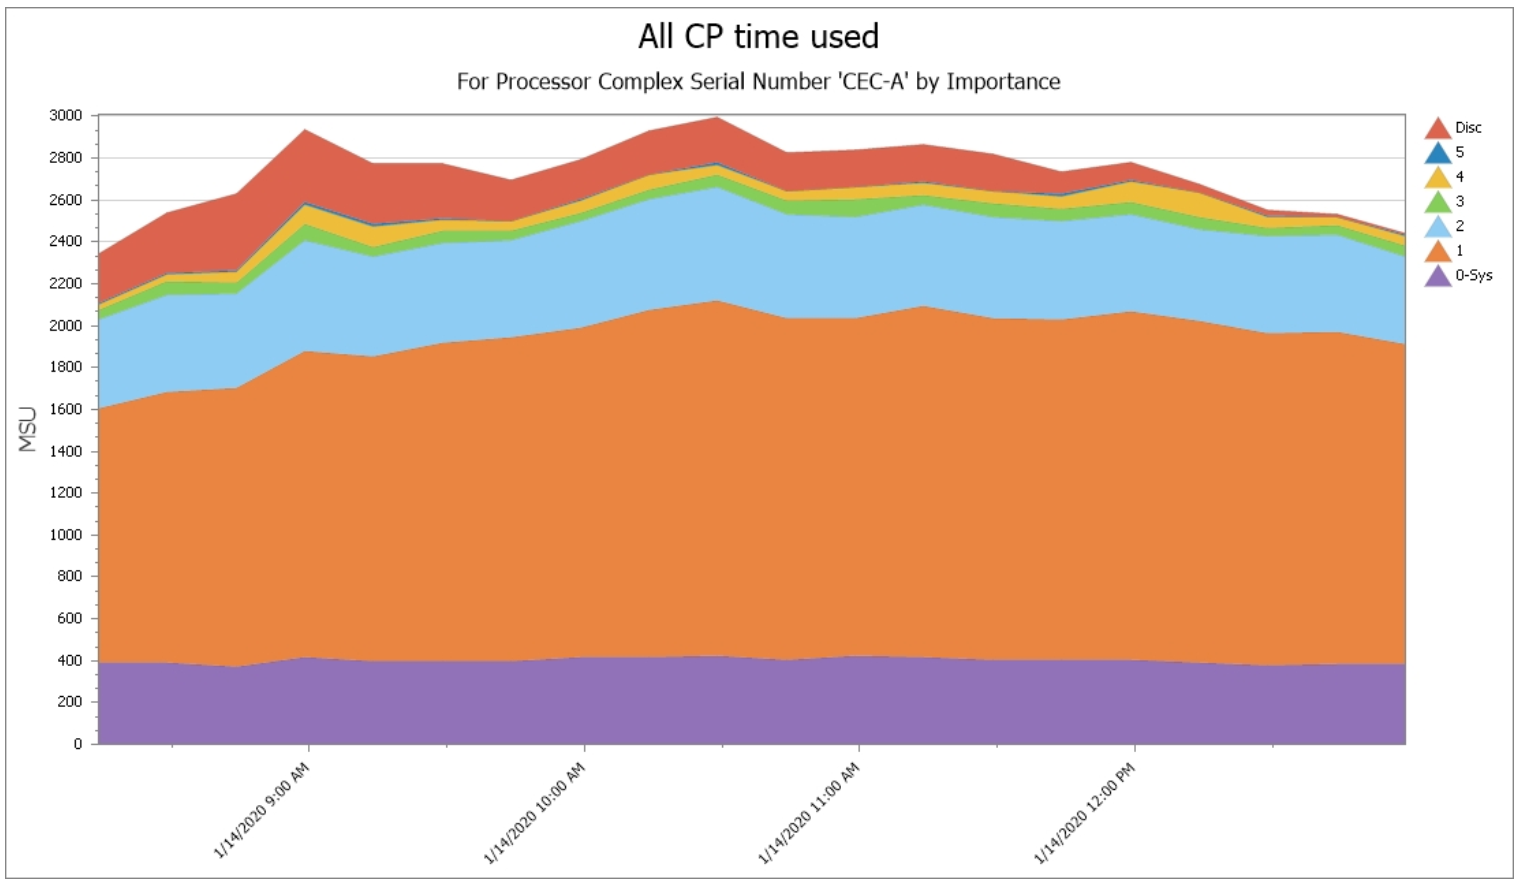
Drilldown to CPU Use by WLM Importance
Illustrating the drilldowns for CPU analysis described in “CPU Use during Peak Interval,” this view displays the workload by WLM importance level when that drilldown is selected. If this interval represented a monthly peak, this view might prompt further analysis of the sizable Discretionary workload executing during this time (see “Key Feature 7” below).
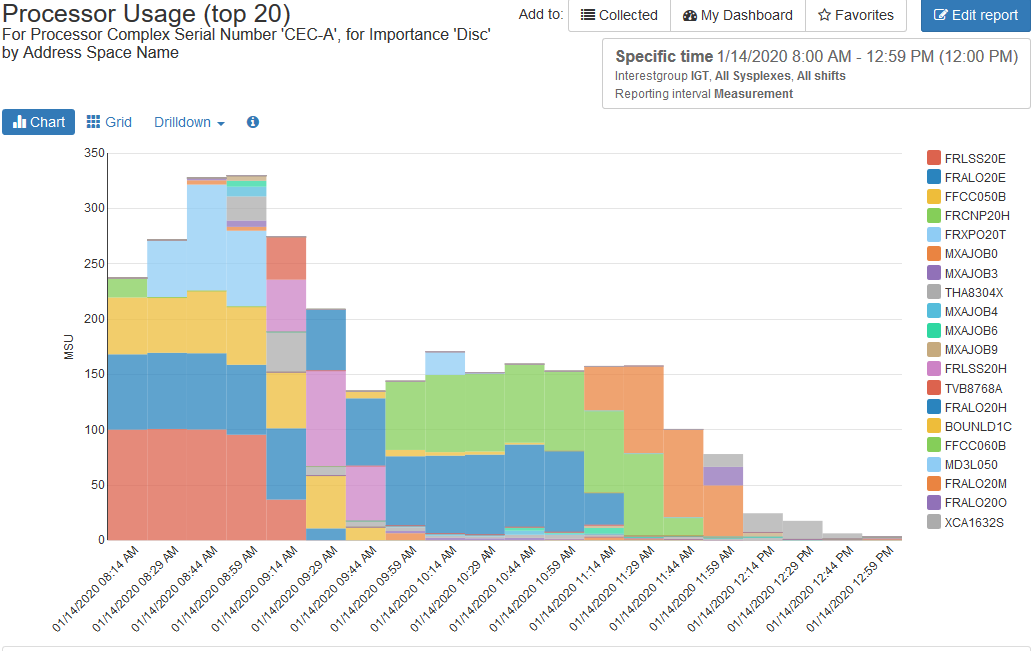
Drilldown to CPU Use by Address Space
As suggested in “Drilldown to CPU Use by WLM Importance,” this drilldown allows you to see the specific address spaces classified by WLM as discretionary that were executing and thus contributing toward the four-hour rolling average value during that interval.
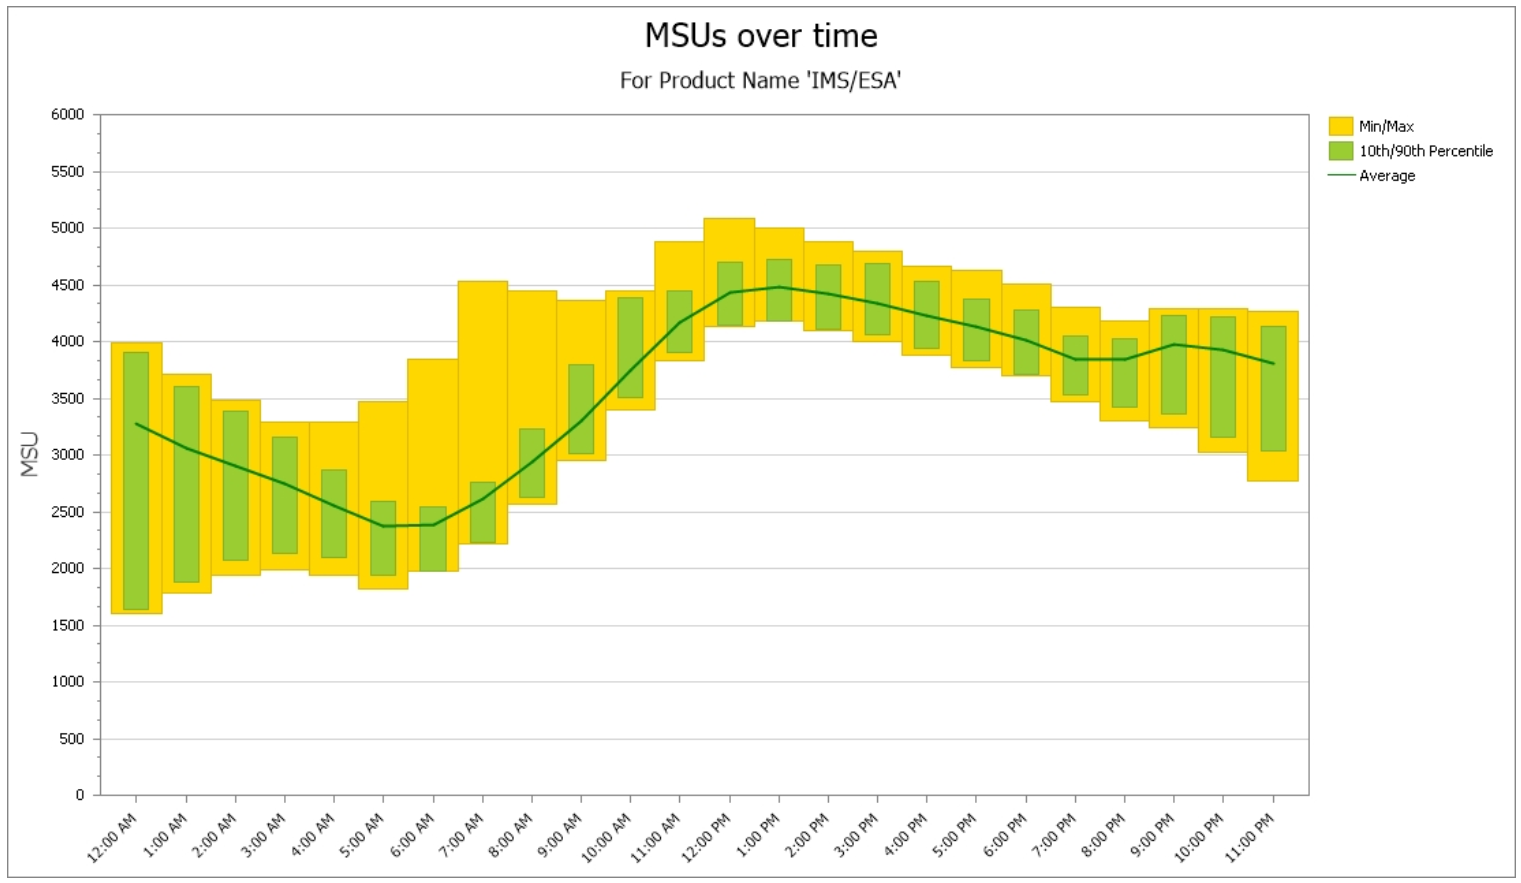
Monthly Time-of-day Profile of Product MSUs
The “Month” drilldown provides a time of day profile across a selected month (likely to be a billing month in this case). This view presents average values (green line), minimum and maximum values (yellow bars), and 10th and 90th percentile ranges (green bars). Since workload profiles are often very different between weekdays and weekends, additional options allow you to narrow the analysis to those periods.
This view of the time of day profile for weekdays over the billing month shows at a glance the degree of variability both by time of day and across the weekdays in this month.
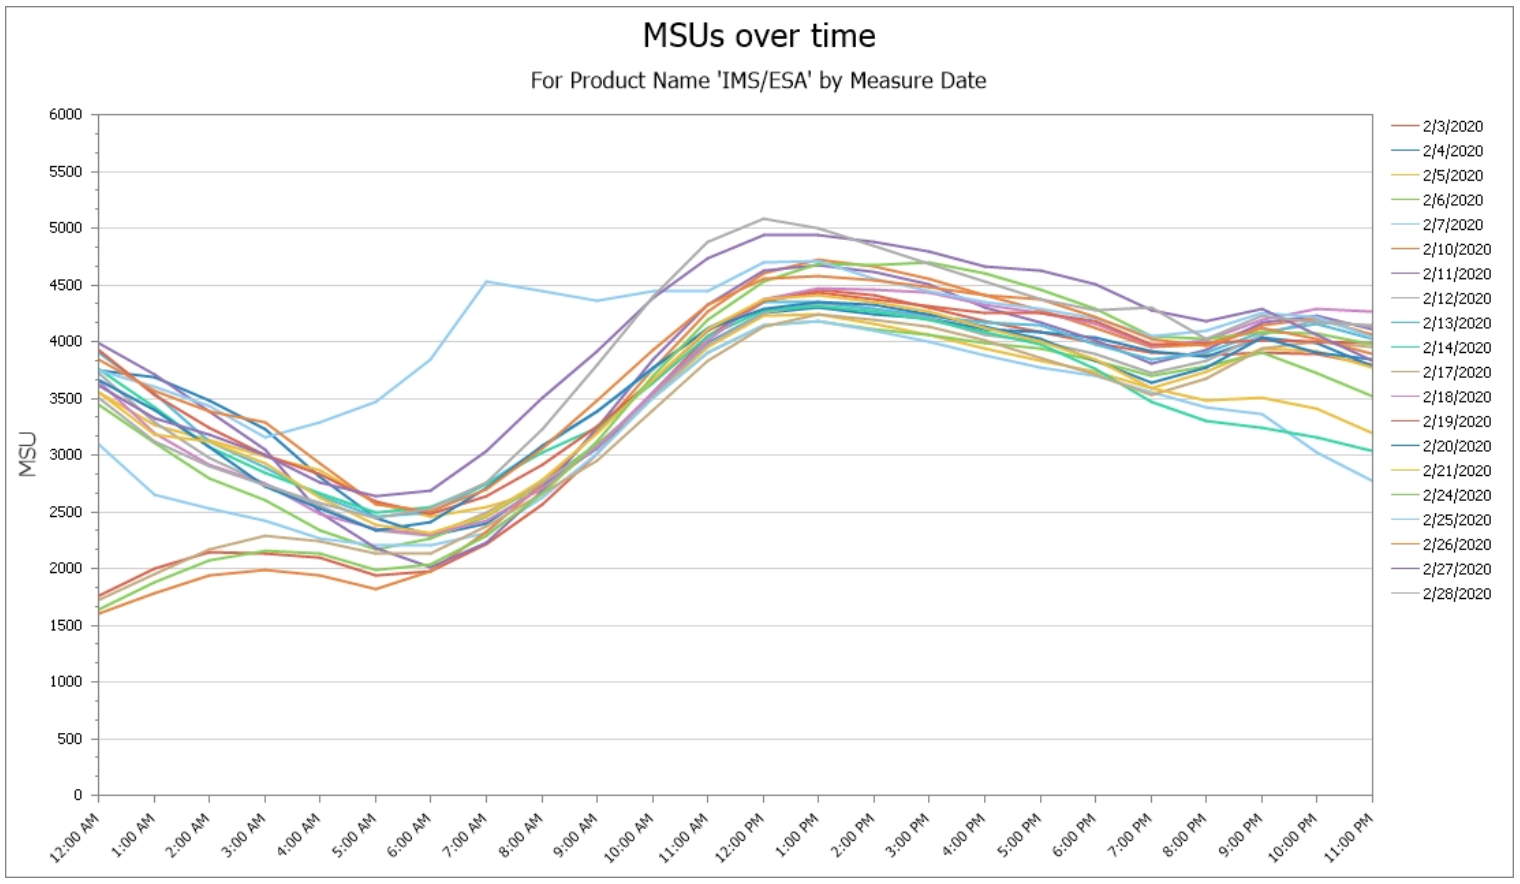
Time-of-day Profile of Product MSUs by Date
Another of IntelliMagic Vision’s powerful analytical capabilities particularly valuable for SCRT analysis is the “By Date” drilldown. This also provides a time of day profile over the selected interval, but in this case each day is represented by a separate line. This view visualizes how much higher the peak value was than the next set of highest peak values and when they occurred, both by date and by time of day.
Time-of-day Profile of Product MSUs by Day of Week
The view provided by this “Day of Week” drilldown can also help quickly identify any variances (or not) of the 4HRA profile for a selected product across the various days of the week.

Flexible Deployment and Monitoring

In the Cloud
Cloud based deployment can be accessed from everywhere in the world and is easy to share with colleagues

Services and Support
Take advantage of IntelliMagic's experienced performance experts for standalone custom services or daily monitoring

On Premise
Install the software on premise and use it offline for total control of your installation
Areas Supported by IntelliMagic Vision for z/OS

Systems, Processors, & MLC
Continual visibility into how the z/OS systems infrastructure is handling your workloads helps you improve performance and protect availability.
Learn More
Top Features

Db2, CICS, WebSphere, TCP/IP, & MQ
Unprecedented visibility into the extensive metrics provided by critical z/OS subsystems to enhance availability and analyze performance.
Learn More

Disk, Tape, & Virtual Tape
Industry-leading visibility and expertise to analyze and proactively identify potential I/O issues in your disk and virtual tape and replication architectures.
Learn More