
Software is the primary component in today’s world that drives mainframe expenses, leading to a direct correlation between software expansion and CPU consumption. Whether it’s a one-time charge model, total CPU consumption, or monthly peaks in rolling four-hour average models, the primary opportunity to achieve cost savings is to reduce CPU. To accomplish this, effective analysis is essential to identify and evaluate potential CPU reduction opportunities.
However, with the multitude of diverse workloads on the mainframe, it becomes essential to have visibility into top CPU consumers and top drivers of CPU growth to focus on the most promising opportunities. One way this can be achieved is through dynamic dashboards designed to give team members a common view across the organization and to enable them to quickly identify and drill down to pursue more detailed analysis of metrics of interest. Figure 1 illustrates a dashboard that captures top 10 CPU consumers for several types of workloads.
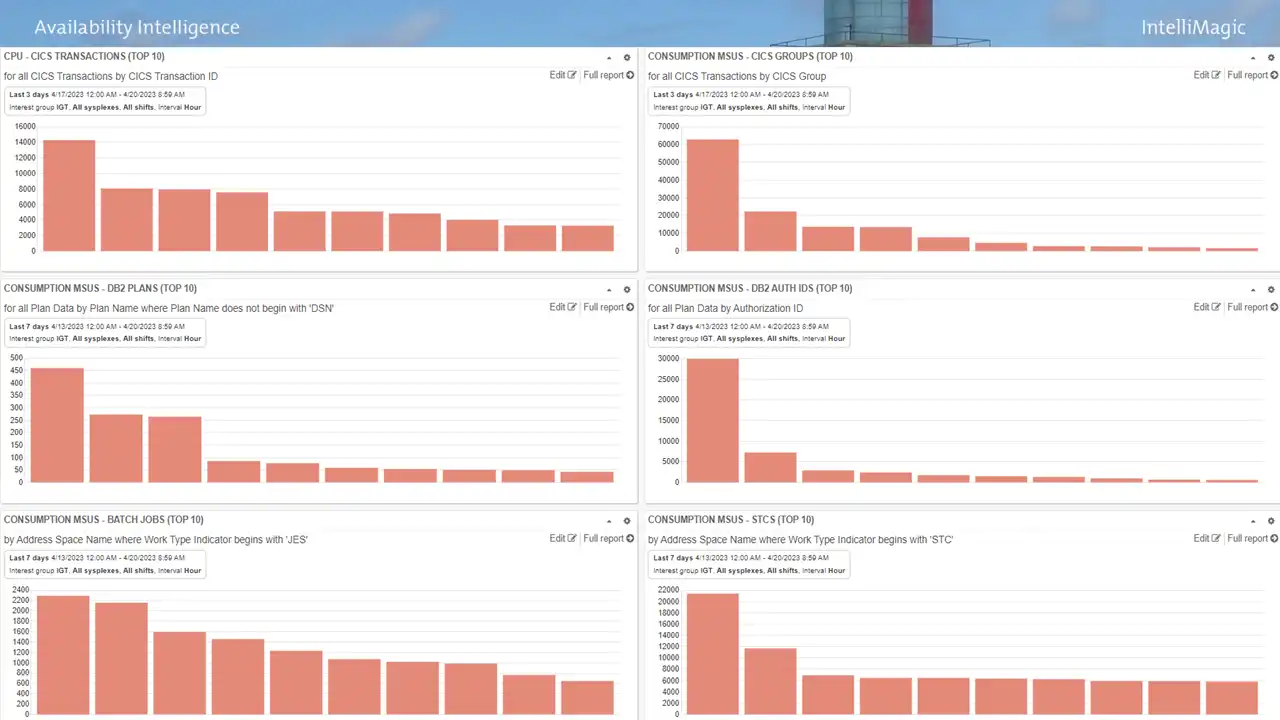
Figure 1: IntelliMagic Vision Dashboard with “Top 10” reports
In addition to CPU reduction, supporting sizable business volume growth with minimal incremental CPU can be another primary avenue of savings for enterprises. For instance, supporting 30% growth in business volumes with a 7% increase in CPU could be considered a significant win.
Timely analysis is also crucial in today’s world, with the growing prevalence of consumption-based software license models where all CPU is in scope. This increases the importance of having visibility into CPU drivers that may be executing at any time.
Furthermore, declining staffing levels leave less time available for analysis, which makes it critical to have capabilities that provide rapid answers for the limited amount of time available for analysis. The growing wave of retirements of 30-plus-year specialists further emphasizes the value of tooling that enables the remaining skilled staff to collaborate across disciplines and contribute in areas outside their specialty. Intuitive shared tooling helps facilitate this teamwork.
The lengthy time often required to answer even relatively simple analytical questions when using legacy tooling reduces the scope of availability exposures and efficiency opportunities that can be investigated by the team, and thus, inevitably results in missed opportunities. Or said another way,
the site that can explore and close on ten lines of analysis in the time it takes another site to answer a single query will be able to identify and investigate and implement ten times as many optimizations.
CPU Optimization Opportunities: Infrastructure Efficiencies
Potential CPU optimization opportunities can be grouped into two primary categories:
- Ones that are applicable to individual address spaces or applications; and
- Ones that apply more broadly across the infrastructure.
This blog will cover some significant optimization opportunities commonly found in the infrastructure. These opportunities often have two significant advantages.
- They can benefit all work or at least a significant portion of work across the system.
- They can often be implemented by infrastructure teams without requiring involvement of application teams, which understandably often have different priorities.
In the ideal situation, you can get IT-wide buy-in and commitment to succeed in identifying and implementing CPU reduction opportunities. In a very successful MLC reduction initiative at my previous employer, the executive over Infrastructure had also previously led Application areas, so he had organization-wide influence and credibility. But if you don’t have that, you can still implement many of the infrastructure changes we will now cover.
Processor Cache Efficiencies
With the architectural changes first introduced with the z13, processor cache efficiency became a major factor in CPU consumption. IBM has implemented cache-related architectural enhancements for each new processor generation, yet for many workloads opportunities to achieve processor cache efficiencies can still contribute toward significant CPU reductions. How can you determine whether this represents an opportunity for you?
First, identify the volume of work executing on Vertical Low (VL) logical CPs. This represents work exceeding the LPAR’s guaranteed share derived from its LPAR weight. Vertical High (VH) CPs have dedicated access to a physical CP and its associated cache. But work running on VLs is exposed to cross-LPAR contention for cache so that its data often gets flushed out of cache by data from other LPARs.
Figure 2 provides a view to answer the question “do you have a significant amount of work executing on VLs?” If not, you can look elsewhere. If so (as is the case in Figure 2), then you need to answer one other question.
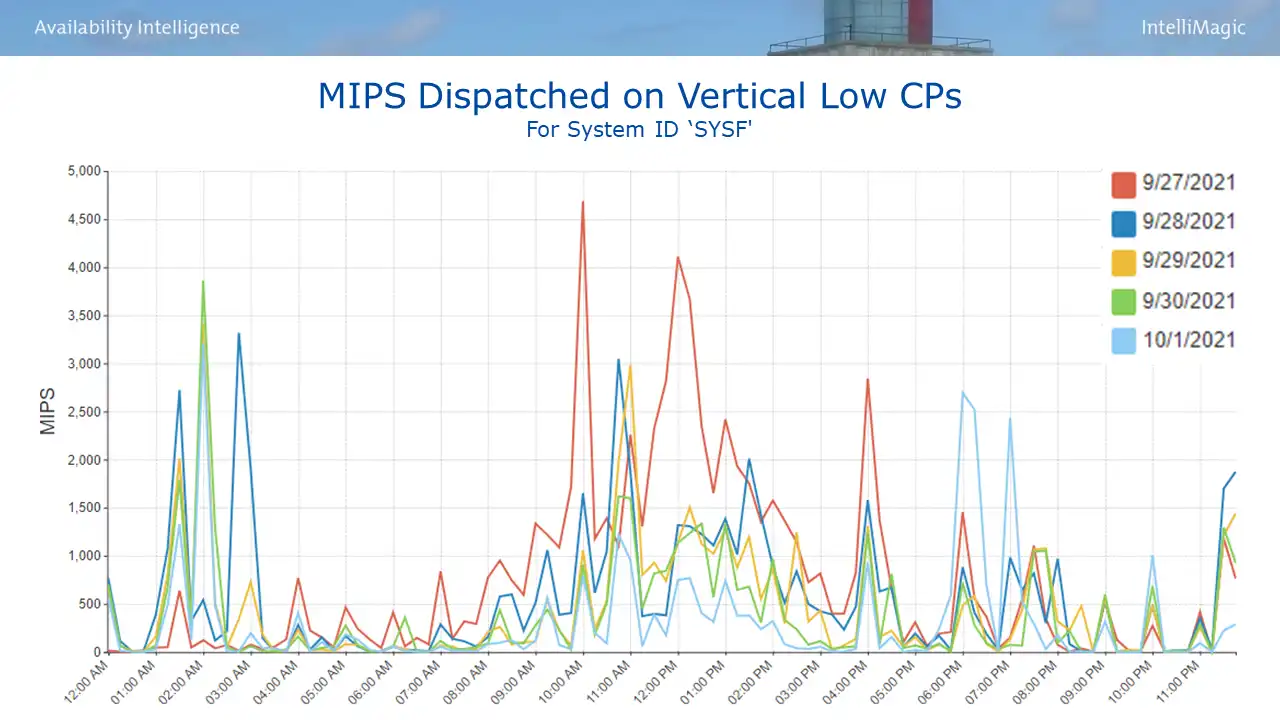
Figure 2: MIPS Dispatched on Vertical Low CPs
If not, you can look elsewhere. If so (as is the case in Figure 2), then you need to answer one other question. “Is there a significant difference in Finite Cycles per Instruction (CPI) between your work executing on VLs and that running on VHs and VMs?” Finite CPI quantifies the machine cycles spent waiting for data and instructions to be staged into Level 1 cache so that productive work can be done. So another way to express this question is “do your VLs have a significant Finite CPI penalty?”
To answer that question, you first need to understand your Vertical CP configuration. In the example in Figure 3, the 10 logical CPs for this system are configured as 5 VLs (in red & blue) and a combination of 5 VHs and VMs (in green and yellow).
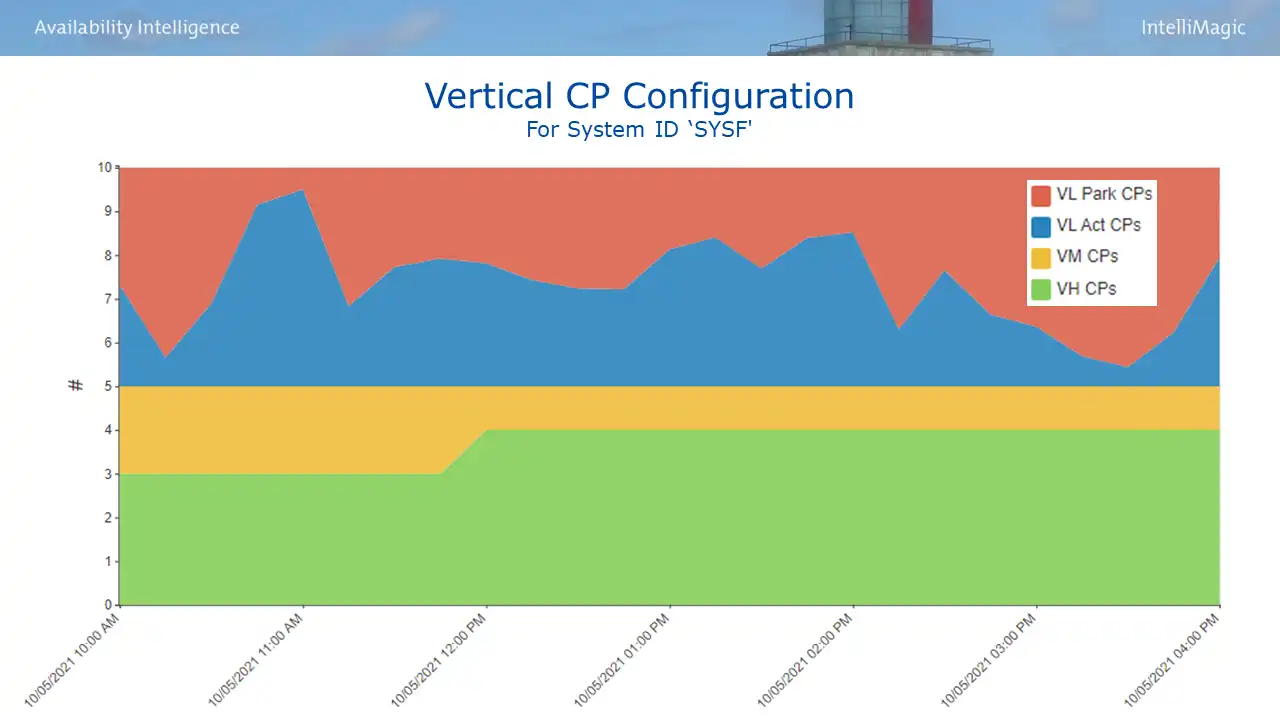
Figure 3: Vertical CP Configuration
Armed with this understanding, you can examine Finite CPI by logical CP to quantify the penalty for the VLs, as shown in Figure 4. A sizable gap between the two sets of lines as seen at the arrow here is a visual indicator of a substantial VL penalty.
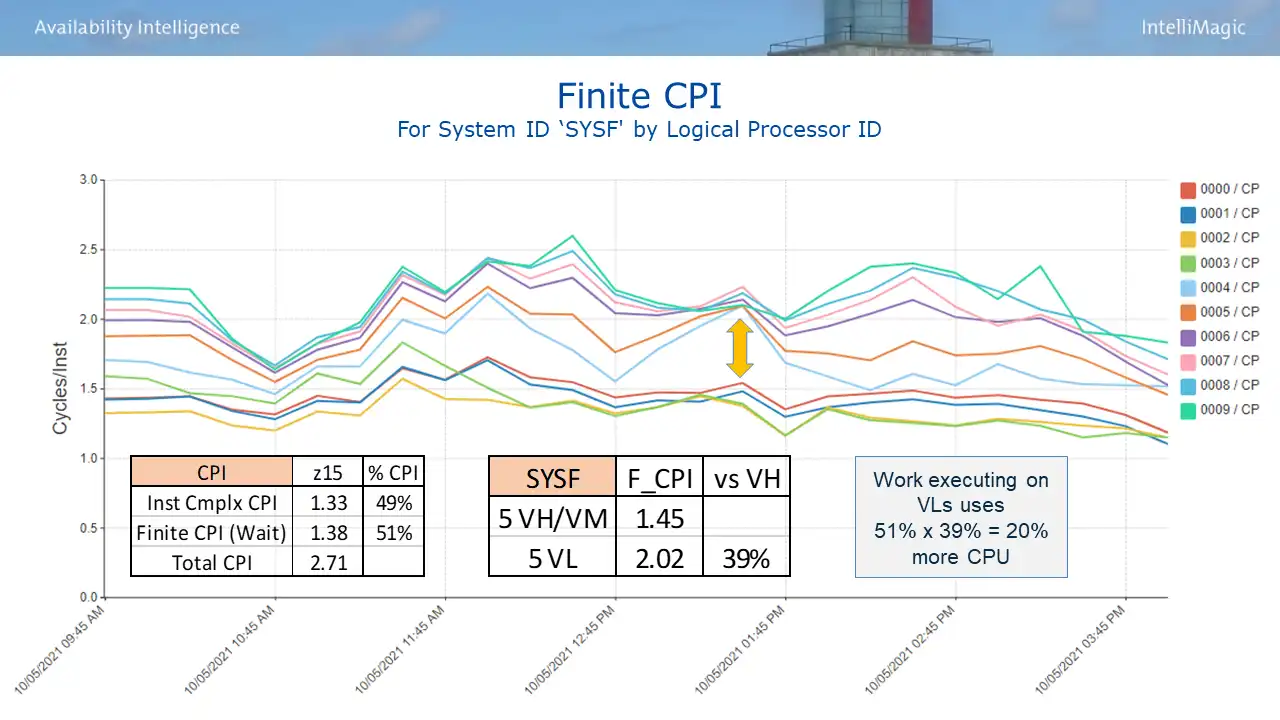
Figure 4: Finite CPI by Logical CP
Here is how the math works, first quantify the Finite CPI penalty for the VLs. To translate this into CPU savings, it needs to combined with the contribution of Finite CPI (waiting cycles) to overall CPI, a value also provided by the SMF 113 data.
On this system, the work executing on VL logical CPs incurs a 39% Finite CPI penalty, and Finite CPI (waiting cycles) makes up 51% of total CPI. So multiplying those two numbers results in a total CPU penalty of 20% for work executing on VL CPs. Or expressed another way, on this system changes that reduce the amount of work executing on VLs would reduce the CPU for that work by 20%.
If you have sizable cache efficiency opportunities like this, what kind of changes can you explore?
Processor Cache Efficiency: LPAR Weight Changes
One course of action could be LPAR weight changes to improve the vertical CP configuration. A good way to identify any such opportunities is through an Engine Dispatch Analysis view as seen in Figure 5, which compares CPU usage of an LPAR over time to its allocated share.
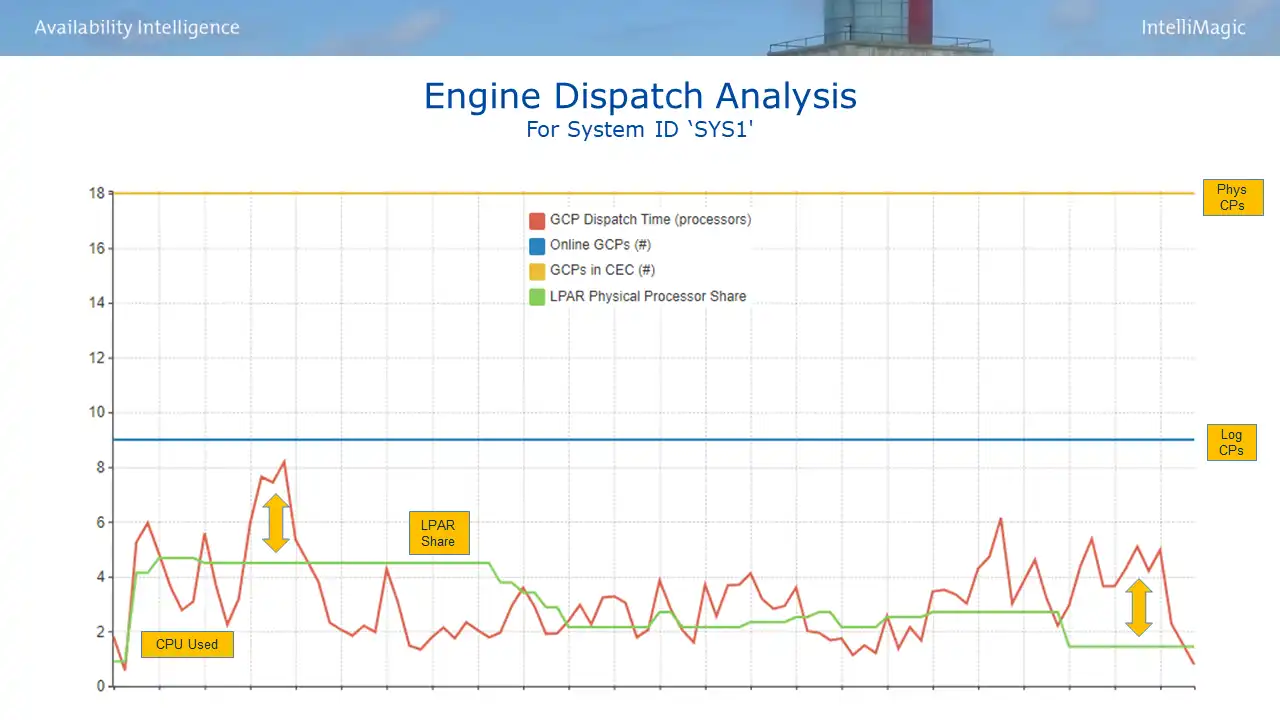
Figure 5: Engine Dispatch Analysis – SYS1
If you have sizable cache efficiency opportunities like this, what kind of changes can you explore? One course of action could be LPAR weight changes to improve the vertical CP configuration. A good way to identify any such opportunities is through an Engine Dispatch Analysis view as seen in Figure 5.
This view presents four variables.
- The number of physical CPs on the processor (in yellow, 18 here)
- The number of logical CPs for the selected LPAR (in blue, 9 here)
- The LPAR guaranteed share (in green), which is a function of LPAR weight and # of physical CPs
- Note: The LPAR share is variable here because IRD (Intelligent Resource Director) is active causing PR/SM to dynamically change LPAR weights.
- The interval CPU consumption in units of CPs (in red)
We will analyze two different LPARs that reside on the same processor. The arrows on Figure 5 highlight night shift intervals for this first LPAR (SYS1) where CPU usage far exceeds its share, resulting in lots of work executing on VLs.
Compare this to the situation for a second LPAR (SYS2) during those night shift intervals, shown in Figure 6. The guaranteed share (in green) is far higher than CPU usage (in red), reflecting that SYS2 has far more weight than it needs.
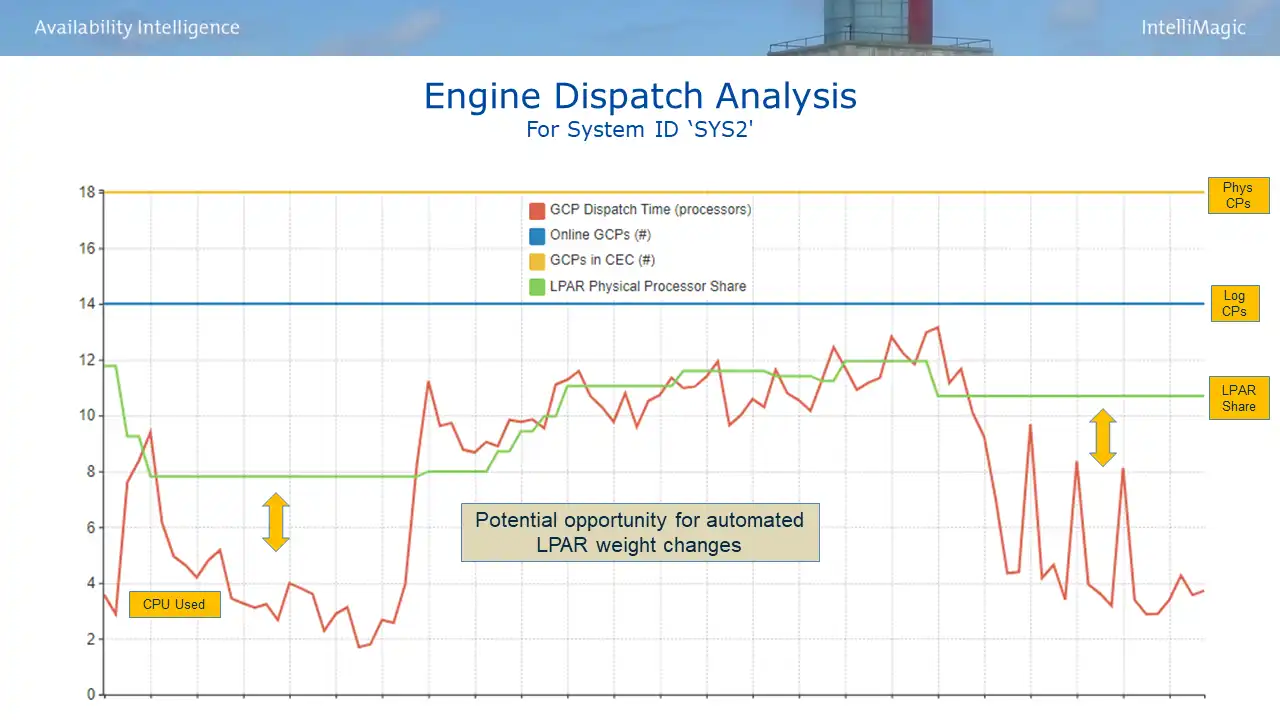
Figure 6: Engine Dispatch Analysis – SYS2
This is an example where automated LPAR weight changes between these two LPARs could help that night-shift work run more efficiently on SYS1 with no adverse impact to SYS2.
Processor Cache Efficiency: Sub-capacity Models
A second approach to consider to potentially improve cache efficiency is sub-capacity (“sub-cap”) processor models. They were originally created to give smaller customers more granular upgrade options. But having more (slower) physical CPs means more CPs for the same purchased capacity and thus more processor cache. Since effective use of cache can play a big role in delivered capacity, sub-cap CPCs often deliver more capacity than expected.
Historically this was considered only of interest to sites with relatively small installed capacities. But today large sites often have a mix of larger production CPCs and smaller CPCs with development LPARs, the latter may also be excellent candidates for a sub-cap model.
Also, the fact that on z16 processor models 6xx models now run at x% of full speed (vs. x% on prior z15 models) can also expand the pool of sites that could benefit from sub-cap models. The legitimacy of this approach was reinforced earlier this year during the SHARE Performance Hot Topics session in Atlanta when Brad Snyder from the IBM Washington Systems Center also advocated for a growing role for sub-cap models.
For more information on this subject I refer you to this zAcademy session, Is a Sub-Capacity CPC the Right Move for You?, that Frank Kyne and I presented on this subject.
Conclusion
CPU reduction is the primary means of attaining mainframe cost savings, and effective analysis is essential in identifying and evaluating potential CPU reduction opportunities. Visibility into top CPU consumers and top drivers of CPU growth can help focus scarce staff resources on the most promising opportunities.
There are a wide range of potential options on the “menu” of common CPU optimization opportunities. Future iterations of this blog will present many other avenues for potential savings. Many items may not represent opportunities in your environment for one reason or another. But I expect you will find several items worth exploring as potentially applicable which may lead to substantive CPU savings.
Ways to Achieve Mainframe Cost Savings
This webinar is designed to expand your awareness of ways sites have reduced CPU and expenses so that you can identify ones potentially applicable in your environment.
This article's author
 Todd Havekost
 Share this blog
You May Also Be Interested In:
Why Am I Still Seeing zIIP Eligible Work?
zIIP-eligible CPU consumption that overflows onto general purpose CPs (GCPs) – known as “zIIP crossover” - is a key focal point for software cost savings. However, despite your meticulous efforts, it is possible that zIIP crossover work is still consuming GCP cycles unnecessarily.
Top ‘IntelliMagic zAcademy’ Webinars of 2023
View the top rated mainframe performance webinars of 2023 covering insights on the z16, overcoming skills gap challenges, understanding z/OS configuration, and more!
Making Sense of the Many I/O Count Fields in SMF | Cheryl Watson's Tuning Letter
In this reprint from Cheryl Watson’s Tuning Letter, Todd Havekost addresses a question about the different fields in SMF records having different values.
Book a Demo or Connect With an Expert
Discuss your technical or sales-related questions with our mainframe experts today