
Businesses often struggle trying to reduce mainframe and other IT infrastructure costs. Before you can get started reducing your mainframe costs, you should understand what drives those costs. To a large extent, how much you spend in total, software, hardware, and infrastructure management is driven by your consumption. What metric(s) does IBM provide to track and calculate how much you pay in software? How does that relate to hardware and infrastructure management?
Whether you are an experienced z/OS analyst, or someone new to the industry, you may be asked (or told) to recommend ways to reduce those costs. An important first principle is: KISS or Keep It Simple Stupid.
In this blog, I’ll cover the commonly used metric for IBM software licensing, and how you can track and report on your results using those measurements to help the business side of the house understand what’s behind the costs of what is often the largest line item in the IT budget. There are numerous ways to reduce your mainframe costs that we have covered in the past. I’ll link to those resources throughout this blog.
MSUs Consumed: The IBM Metric for Software Licensing
The primary metric for understanding mainframe costs is MSUs consumed. It provides a direct means to attribute software cost. While unrelated to hardware, data center, and mainframe management costs, there is a strong correlation. More consumption means bigger data centers, more power and more people needed to manage the systems. I would argue there are economies of scale, but for near term planning you won’t generally jump to a lower scale when it comes to costs.
The Sub Capacity Reporting Tool (SCRT) is still the standard by which most folks are paying IBM for z/OS software. To understand precisely how MSU’s consumed impacts and drives your software expense, you need to understand what pricing model you are currently under (primarily):
- Traditional 4-Hour Rolling Average (4HRA/R4HA)
- Newer Tailored Fit Pricing Models (TFP)
Regardless of which pricing model you use, MSU’s consumed is still the primary software pricing metric. The difference is mostly whether that consumption occurs for every hour covered in the licensing term (likely yearly or years), or for the peak four hour rolling average (4HRA), (monthly).
4-Hour Rolling Average Cost Reporting
Under the traditional 4HRA/R4HA methodology, the key time frame where mainframe costs attributed happens during the peak 4 hour rolling average for a month.
The reduction strategy here often includes identifying which work can be moved outside of peak periods to non-peak periods, which would decrease your overall 4HRA, thus reducing your software bill. Not
surprisingly, peak demand drives other costs too. It drives processor capacity allocations, (hardware cost & software) and it likely parallels other hardware and infrastructure costs similarly.
MSU’s Consumed Under Tailored Fit Pricing (TFP)
Under the newer TFP models, IBM charges based on total MSU consumption. This means that any MSU savings introduced can have a material effect on your software costs regardless of when it is consumed, peak 4HRA or not (the other 950+ hours per month).
While each mainframe shop will have different agreements in terms of time frames, entitlement targets, and over/under target assessments, a reduction in ongoing MSU demand will eventually net reduced software expenses.
For more information regarding reducing software costs, refer to these resources:
- Processor Cache
- 4HRA & Other Optimizations
- Tailored Fit Pricing Considerations
- Reducing automated tasks
- Tuning Applications
MSU Demand and Annual Mainframe Software Cost
Assuming you have a stake or responsibility for the mainframe budget, you need to know your organization’s budgeted annual z/OS software bill. Your focus can become more intense when you recognize the annual z/OS software cost (SC) and the pricing model used to attribute that cost (tailored fit pricing, 4HRA). Furthermore, ask for the total annual mainframe budget (AMB), while you are at it.
Once you have these budget lines, you can do the math using MSU consumptions, to determine a pretty good approximation of software cost and total costs.
If your demand is 10,000 MSU, at peak 4HRA, and a resource reduction effort saves 100 MSU consistently at that time, the annual savings going forward is 100/10,000*100 = 1%.
One percent may not seem like much, but in a shop where the annual software budget for z/OS is $10M, that’s $100,000 of annual savings (SC).
Let the accountants determine the value of your investment and the timing of booking the savings. While I have long forgotten my brief education in accounting, I believe any reduction in expenses generally goes directly to earnings. This seems to get the attention of executives, whose compensation is often based on earnings targets.
Without much effort, this estimate can be extended beyond software costs by assuming you have the whole mainframe budget, including IBM software broken out separately. If you similarly attribute other mainframe costs to the MSU consumption, the whole mainframe budget, not just software may be estimated. While this may be a gross generalization, there may be some benefits to doing so.
It’s not a stretch to say that 1/3 of IT budgets are software expenses or (SC/AMB=1/3). That math would indicate the total savings of 1% over a long period of time could result in $300k annual savings. The math will be different for a different licensing model, but once you have MSUs (interval at peak 4HRA, or hourly consumption MSUs for TFP) you can get that percentage.
I’ll admit this is crude, and if you have more detail you want to include and use in your analysis, you can certainly do that. My tilt is toward the KISS principle so that I can spend my time on the real work of cost reduction, versus arguing over the accounting details. To put a finer point on this view, someone may contest that you haven’t considered capture ratio. Here’s my response:
- If your capture ratio is around 95%, you are at most going to be 5% off with the reporting estimate, and the 5% difference won’t make or break the decision on whether to save 95% of what is on the table.
- We should really focus our time on pursuing the savings rather than counting 100 out of 100 beans. Leave that for the bean counters.
How to Track Your MSU Consumption and Find Areas to Lower It
Since each IBM processor has a given MSU rating, attributing the consumption values over time is simply the central processor MSU rating * usage of the work in question/total usage.
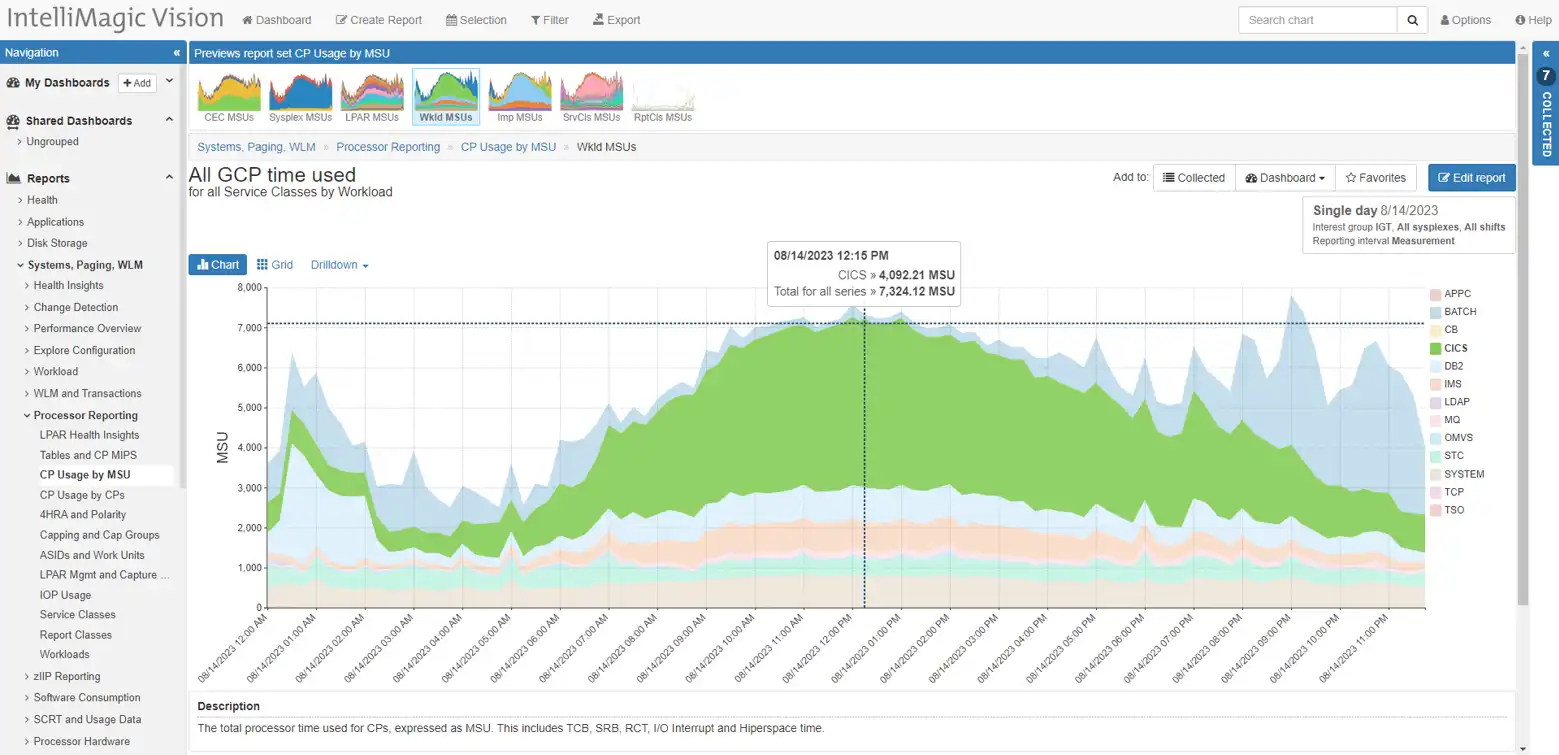
Figure 1: Daily Interval MSU consumption (CICS highlighted vs. total) CICS is over ½ at peak Interval
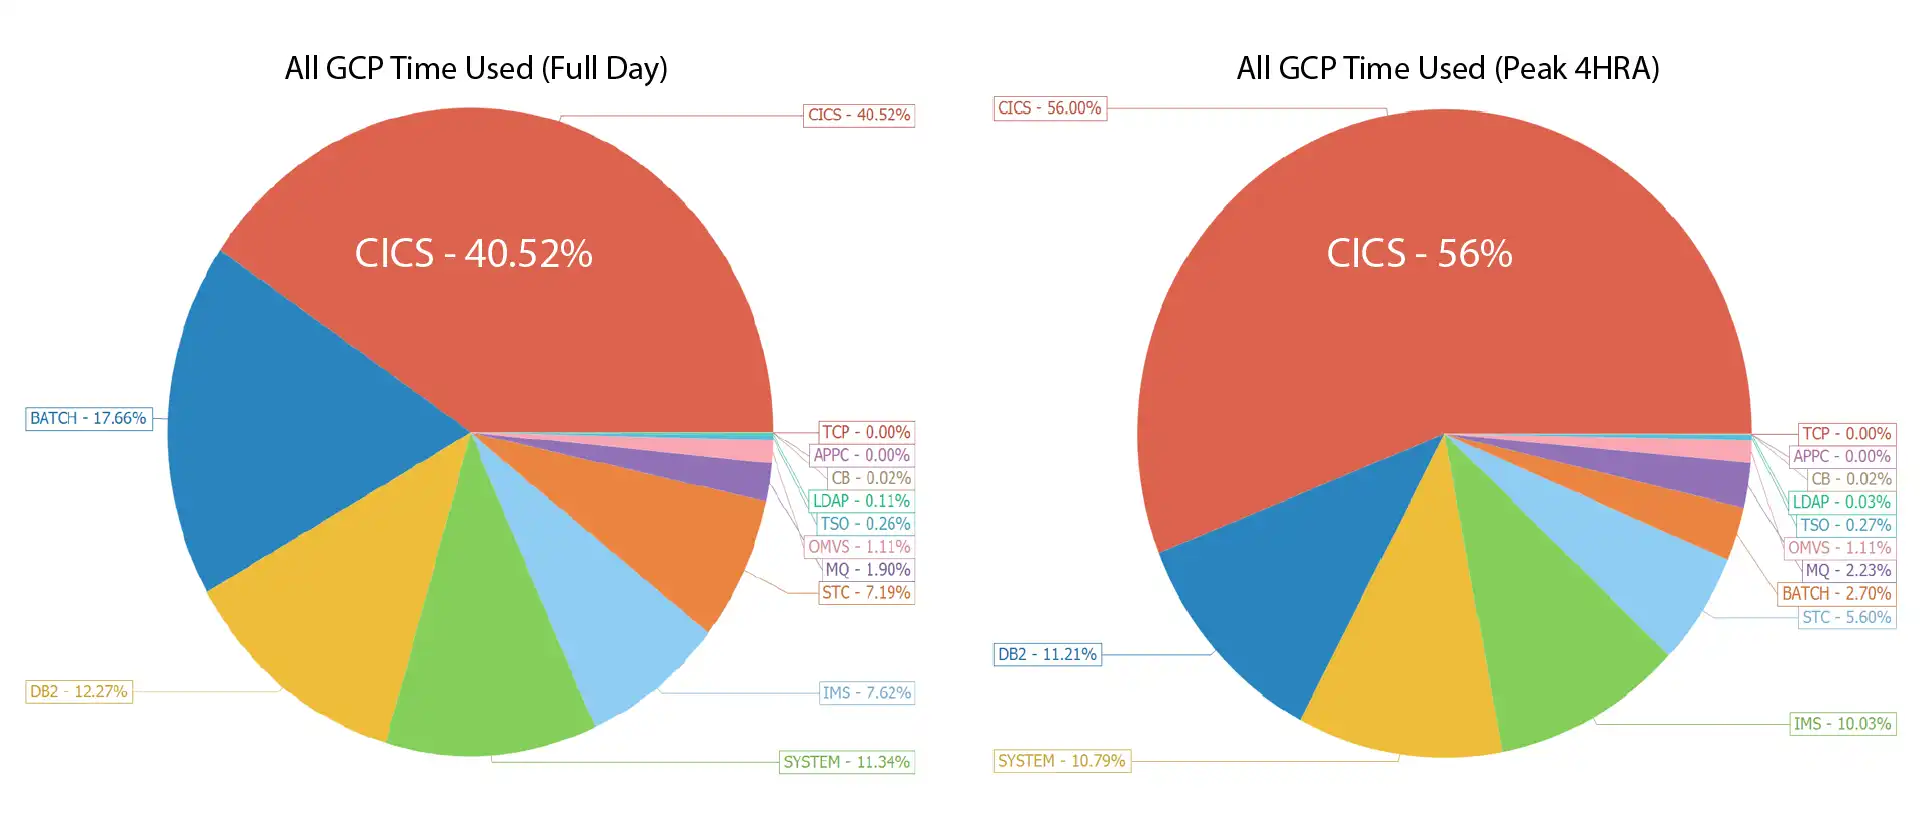
Figure 2 – Percentages CICS Full Day vs Peak 4HRA
Figure 2 represents the Area Chart with 2 Pie charts. These show the importance of knowing your MLC pricing model. For a full day, CICS will approximate 41% of the total MSU consumption, whereas CICS represents 56% of the peak 4HRA for the same day.
If you were fortunate enough to achieve a 10% savings in MSU on the CICS workload, the application of that savings across the CICS workload at 41% vs. 56% makes a big difference in your savings estimate. MSU savings of 4.1% vs. 5.6% savings on a $10M annual software bill is $150,000. Getting the fundamental assumptions aligned with the business side – software pricing model – will help build your credibility when you’re presenting to executives.
Reporting on Mainframe Cost Savings
1) Identify Opportunities
The first step in optimization efforts is to identify opportunities. We’ve outlined some resources above to help you, but don’t stop there. Other resources include conference attendance (i.e. SHARE, GSE), newsletters like IntelliMagic’s and Watson & Walker almost always contain ways to optimize your system configurations and workloads. Other resources include blogs from industry thought leaders in the Db2 and CICS arenas.
2) Know Your Workloads and Configurations
Second, know your workloads and configurations. There’s no substitute for knowing your top 5 workloads, and if you’re on 4HRA, the top 5 workloads during the monthly peaks.
Reports like Figure 3 are essential. Tailor the views to what you want to focus on. Working with applications on specific consumers, Db2 users, CICS transactions, and time frames.
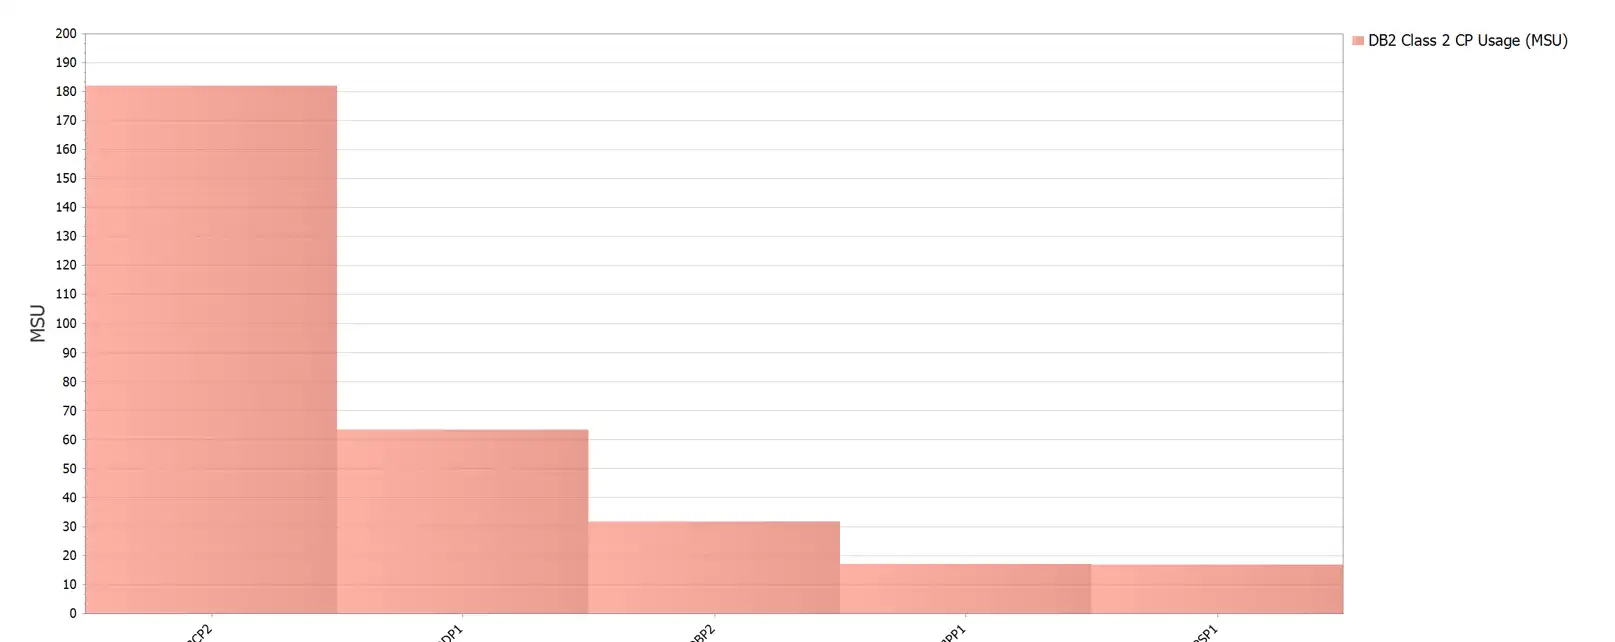
Figure 3 – Top 5 MSU Consuming Db2 Authids
Configurations are relatively static, but the addition of processors, LPARS, and workload changes over time create opportunities for Murphy to sneak in and create chaos.
3) Use Meetings to Highlight Optimization Opportunities
Third, use the regularly scheduled capacity / performance meetings to highlight your views of the most significant optimization opportunities. Several customers are using live dashboards during these meetings to highlight these opportunities and drill into the details.
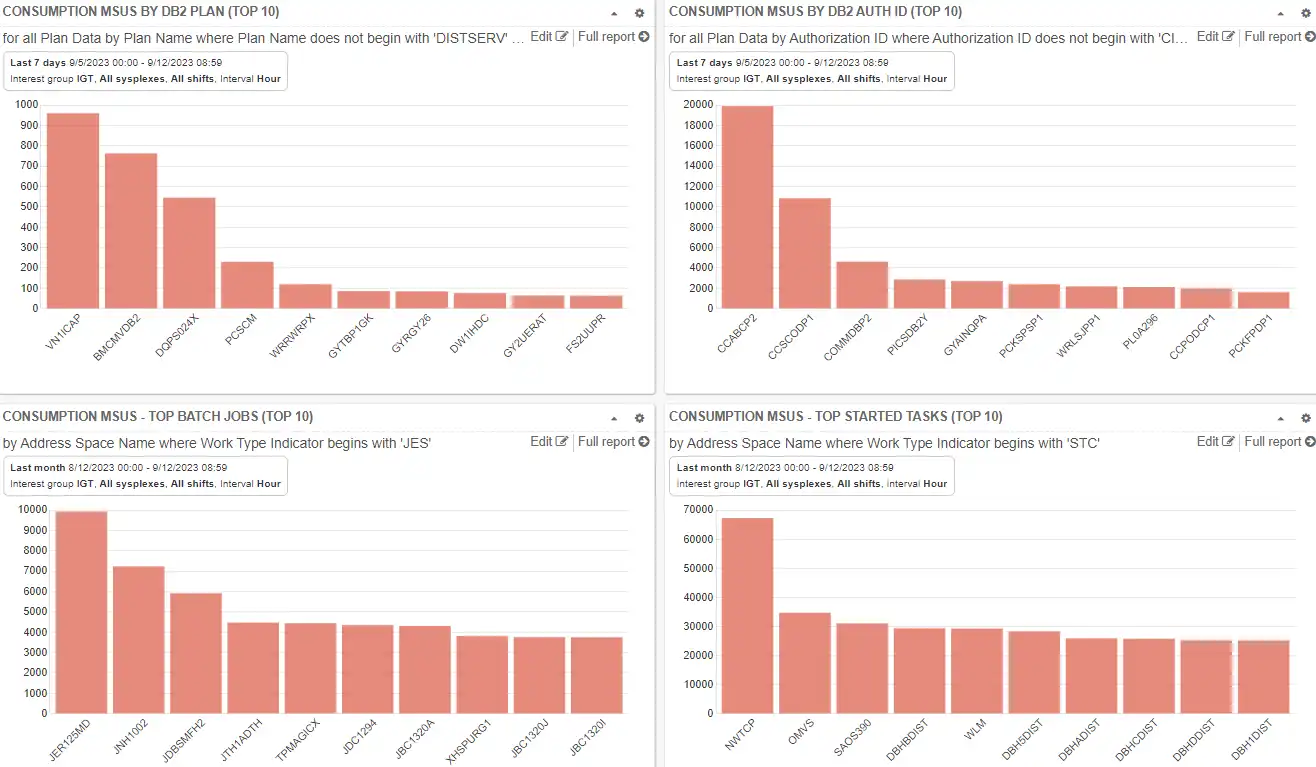
Figure 4 – IntelliMagic Vision dashboard showing Top 10 MSU consumption drivers from several intervals
Execute!
If you’re reading this blog, mainframe software costs constitute a significant portion of your IT budget. I hope this material provides you with some relatively simple steps to help your organization manage the mainframe costs of running the business. These include:
- identifying the magnitude of mainframe application costs
- knowing your mainframe budget details
- knowing the differences of your mainframe software billing model
- developing reporting and a cadence to the reporting that helps monitor and optimize these costs over time
Take the time to methodically go through your environment and make adjustments to lower your MSU consumption and software costs. Selecting the biggest opportunity is not always the best next step. Do a little qualification on the ‘size of effort’ to find a sweet spot and pursue it. Let us know how it goes…
Of course, IntelliMagic’s mainframe consultants are experts at reducing software costs and improving performance. If you don’t have the time or manpower to perform this yourself, we are more than happy to help.
Contact us for a free consultation to learn how we’ve helped countless mainframe sites save money, and how we can help you.
This article's author
 Jack Opgenorth
 Share this blog
You May Also Be Interested In:
Why Am I Still Seeing zIIP Eligible Work?
zIIP-eligible CPU consumption that overflows onto general purpose CPs (GCPs) – known as “zIIP crossover” - is a key focal point for software cost savings. However, despite your meticulous efforts, it is possible that zIIP crossover work is still consuming GCP cycles unnecessarily.
Top ‘IntelliMagic zAcademy’ Webinars of 2023
View the top rated mainframe performance webinars of 2023 covering insights on the z16, overcoming skills gap challenges, understanding z/OS configuration, and more!
Making Sense of the Many I/O Count Fields in SMF | Cheryl Watson's Tuning Letter
In this reprint from Cheryl Watson’s Tuning Letter, Todd Havekost addresses a question about the different fields in SMF records having different values.
Book a Demo or Connect With an Expert
Discuss your technical or sales-related questions with our mainframe experts today