
This doesn’t happen often, but let’s assume you have been assigned to find some cost savings, and you have tools to employ. Finding ‘gold’ in a productive mine field is fun! Your experience with other systems, in similar and other industries, has given you some pretty good ideas on what to look for.
Frequently, CICS ‘tuning’ exercises focus on unnecessary TCB switches. Without getting into what these are and why these might be happening. What makes a good candidate for improvement opportunities?
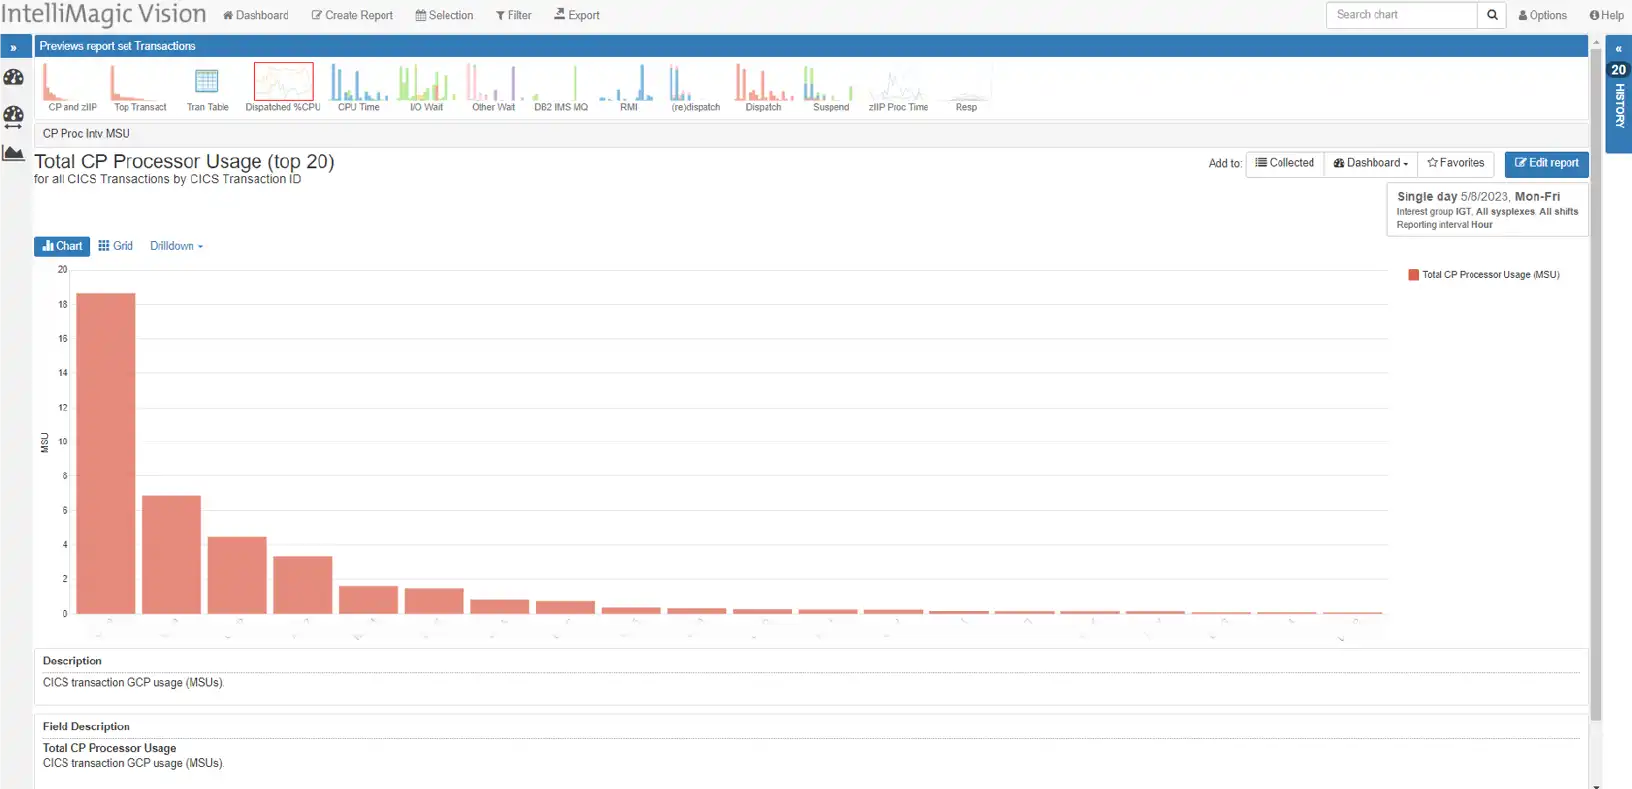
Figure 1: Pareto Chart-CICS transaction MSU consumption
This report has a clear winner for biggest consumer, but after #1, the results tail off quickly. There’s always the possibility it might be ‘fools gold’, but you can’t ignore the size of the 1st item compared to the others.
There’s sometimes a debate on whether TCB switch time or TCB switches are the key item of focus for tuning efforts. Since both metrics are directly related to the same SMF field, it’s not surprising that there is a strong correlation between them, as seen below. It’s also important to recognize that the big hill in the middle of the report is the day-time peak for this transaction rates. Analysts should always be mindful of the distinction between correlation and causation. It may not be the what, but the how that’s important for TCB switches.
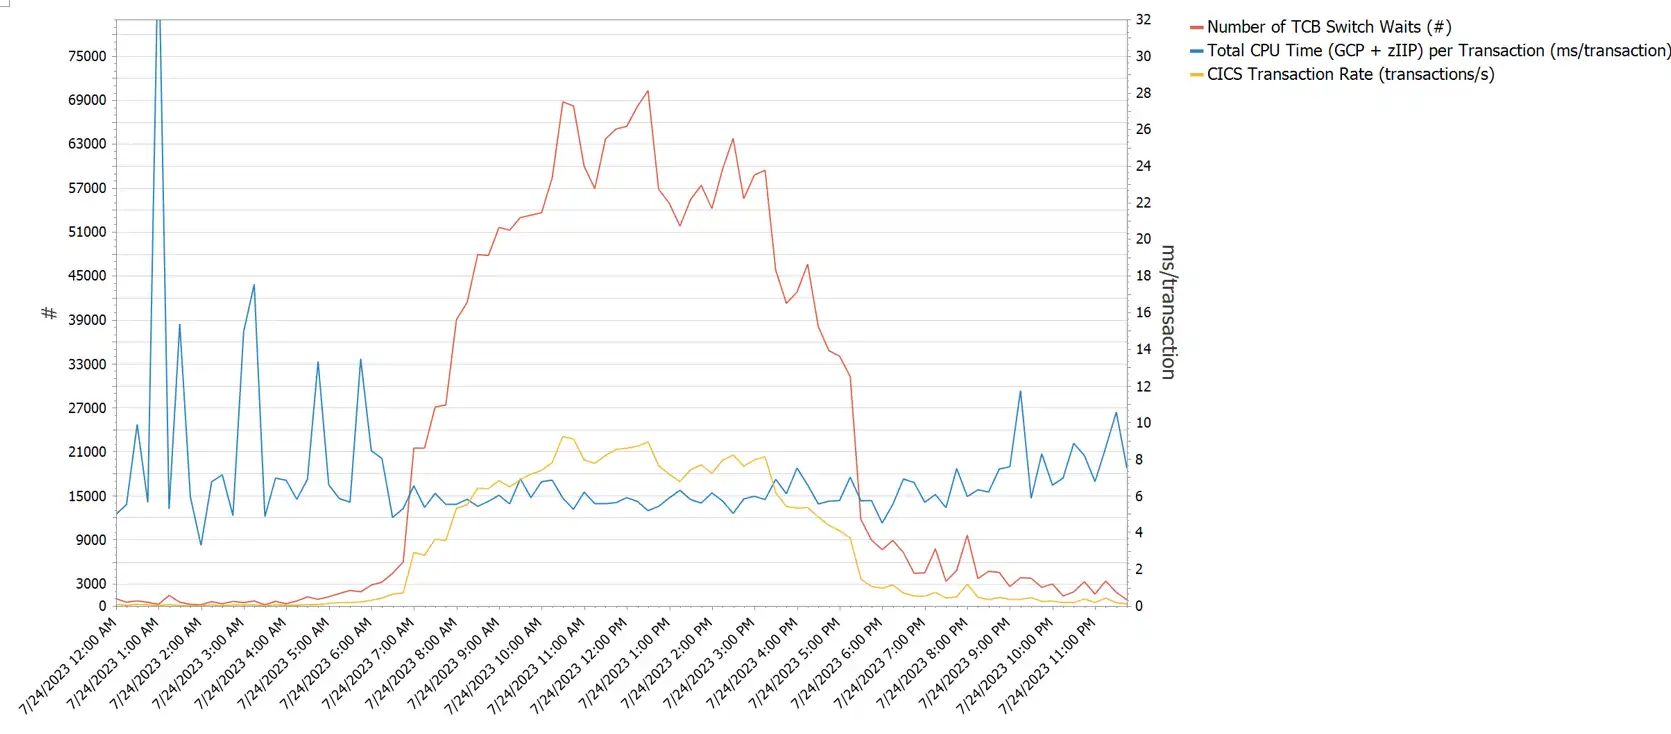
Figure 2: Transaction Rate compared with TCB Switch count and TCB switch time
If TCB Switch time is an important correlation of CPU consumption, then the next Pareto can help us with some early verification of the quality of the nuggets we are looking for. The top CPU consumer, call it Claims, in the first Pareto chart may only be 4th or 5th down the line in TCB Switch Wait Time Pareto chart, so that keeps us on track for a more in depth view of what / how TCB Switch Wait is occurring.
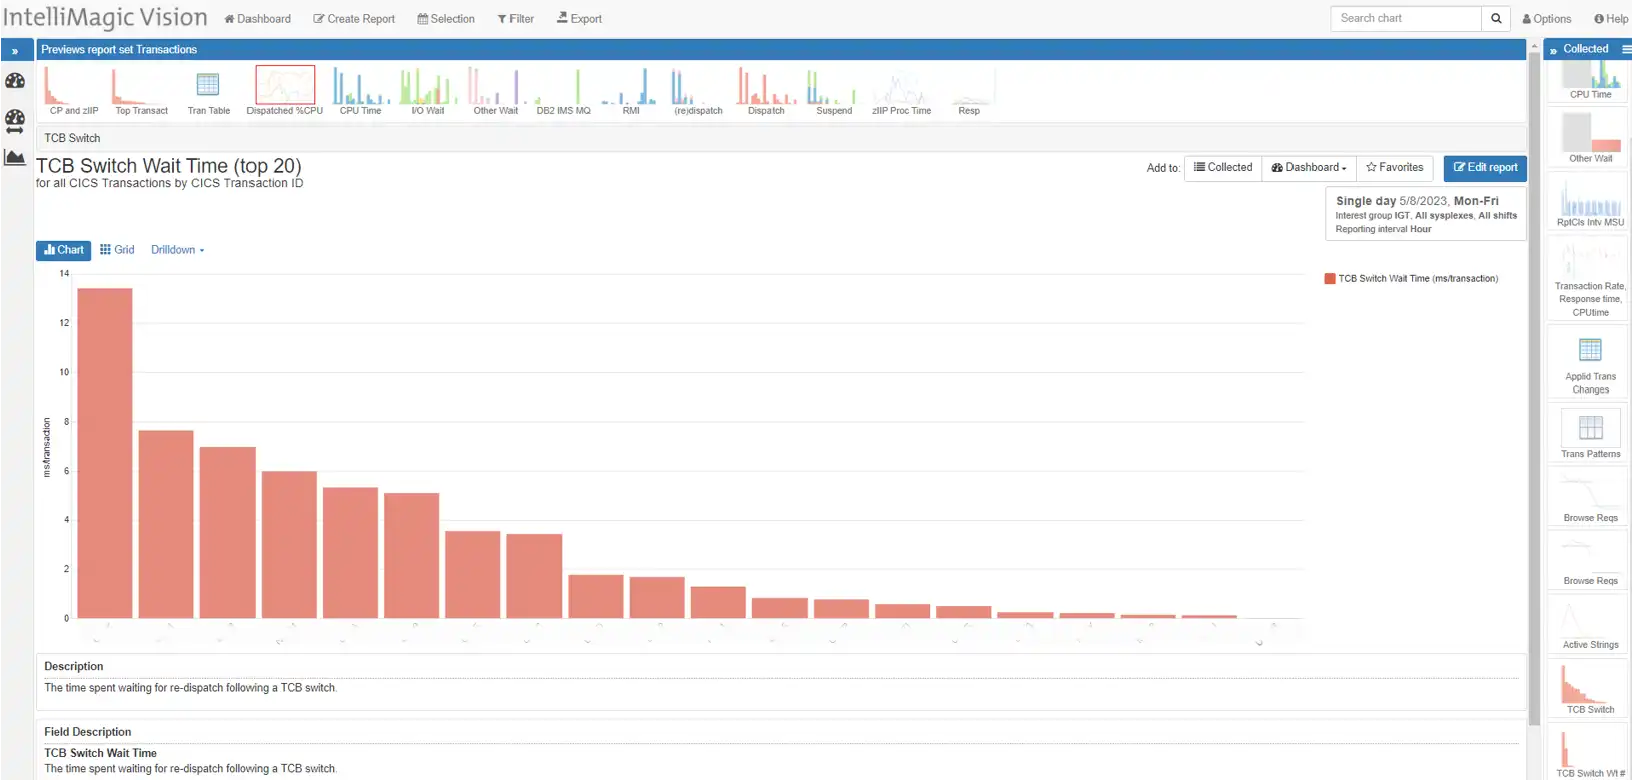
Figure 3: Pareto Chart-CICS transaction TCB Switch Time
The CICS and application experts typically apply their knowledge and experience to find several options for reducing CPU time. I’ll dig deeper into that in the paragraph below, but the next report shows some remarkable improvements!
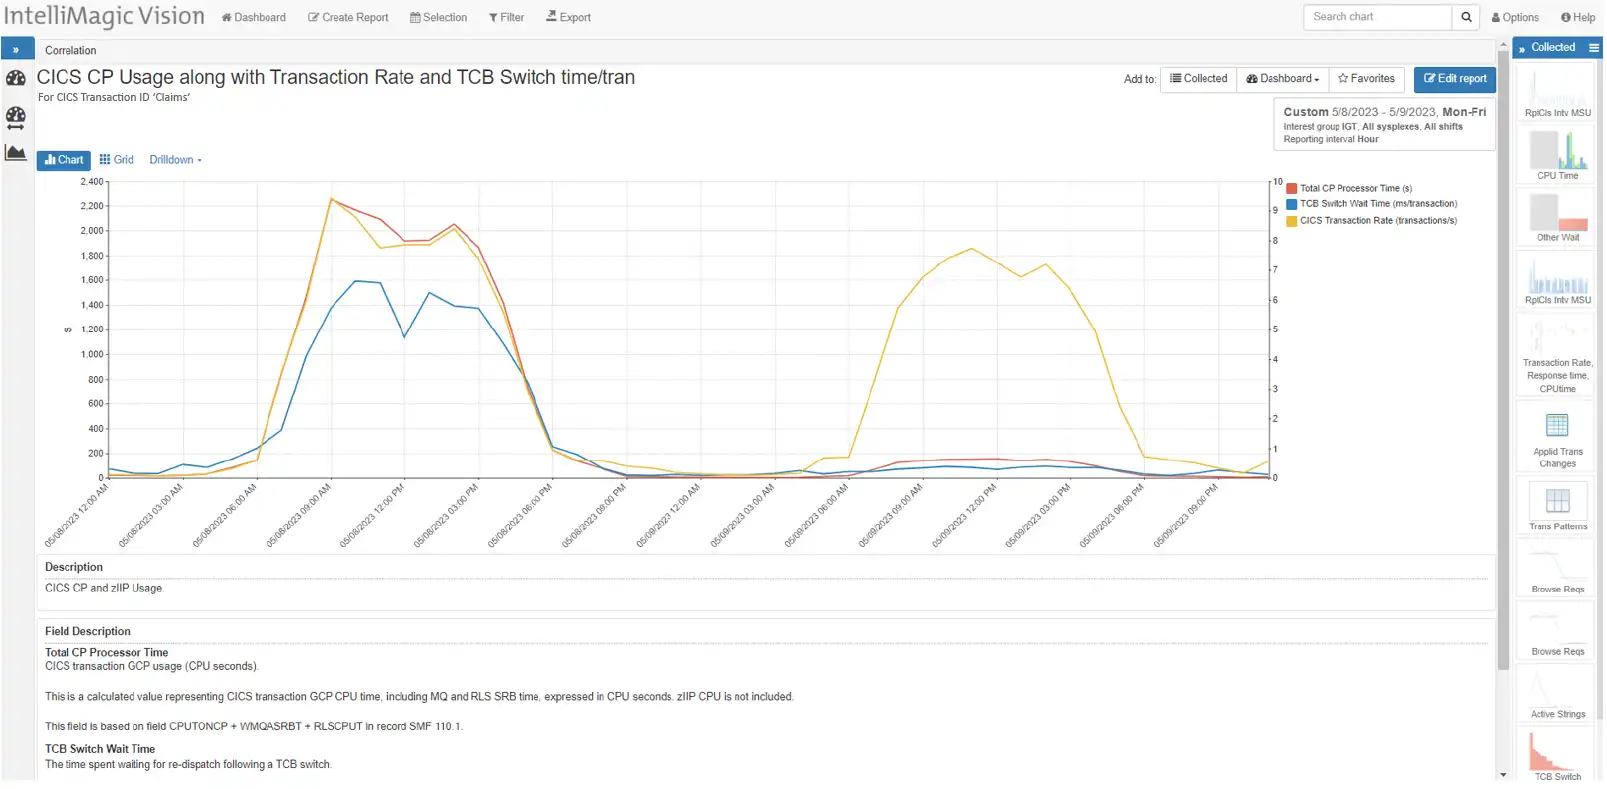
Figure 4: Before-and-after results show a dramatic drop in CP Processor Time and TCB Switch Wait Time
After making a change, TCB switches were greatly reduced – saving up to 2000 CPU seconds at peak for essentially the same transaction workload.
CICS Transaction Details and CPU drivers
Sometimes a fresh set of experienced eyes can spot things that should be done and are easily done. With hundreds of CICS SMF metrics, what are some that we haven’t covered yet that may drive CPU and/or TCB switches?
Some that were involved in these savings include: VSAM Strings, and Buffers and just plain I/O. As this IBM reference suggests, some of this is configuration related and may have been relatively easy to implement. I/O is often overlooked as a driver of CPU, but it does drive CPU, and avoiding I/O with application changes and configuration changes should always be on the list of savings ideas. Trading memory for MSUs $ave$.
Below are a few reports highlighting the changes made over time. Note the critical dates around Dec. 2022, and May 9, 2023. The first report shows a change in mid-December where the number of CICS Active Strings begins showing up and progressively growing worse until early May.
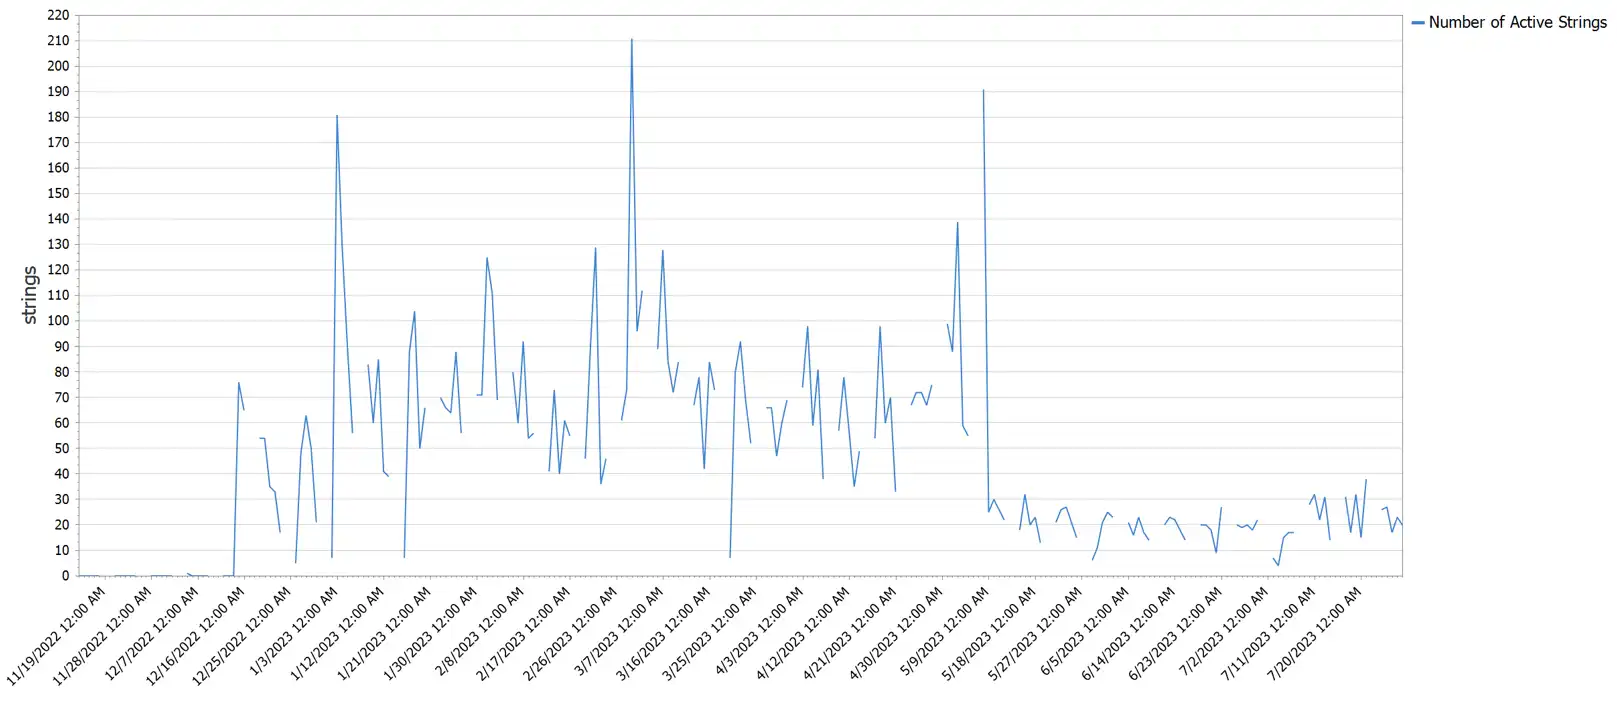
Figure 5: CICS File Control Statistic – Active Strings (current active updates against a file)
The applications changes included CICS changes to ensure performance, but there aren’t always easy ways to ensure performance is protected and costs are controlled. This report below shows that buffer changes went in with the application changes.
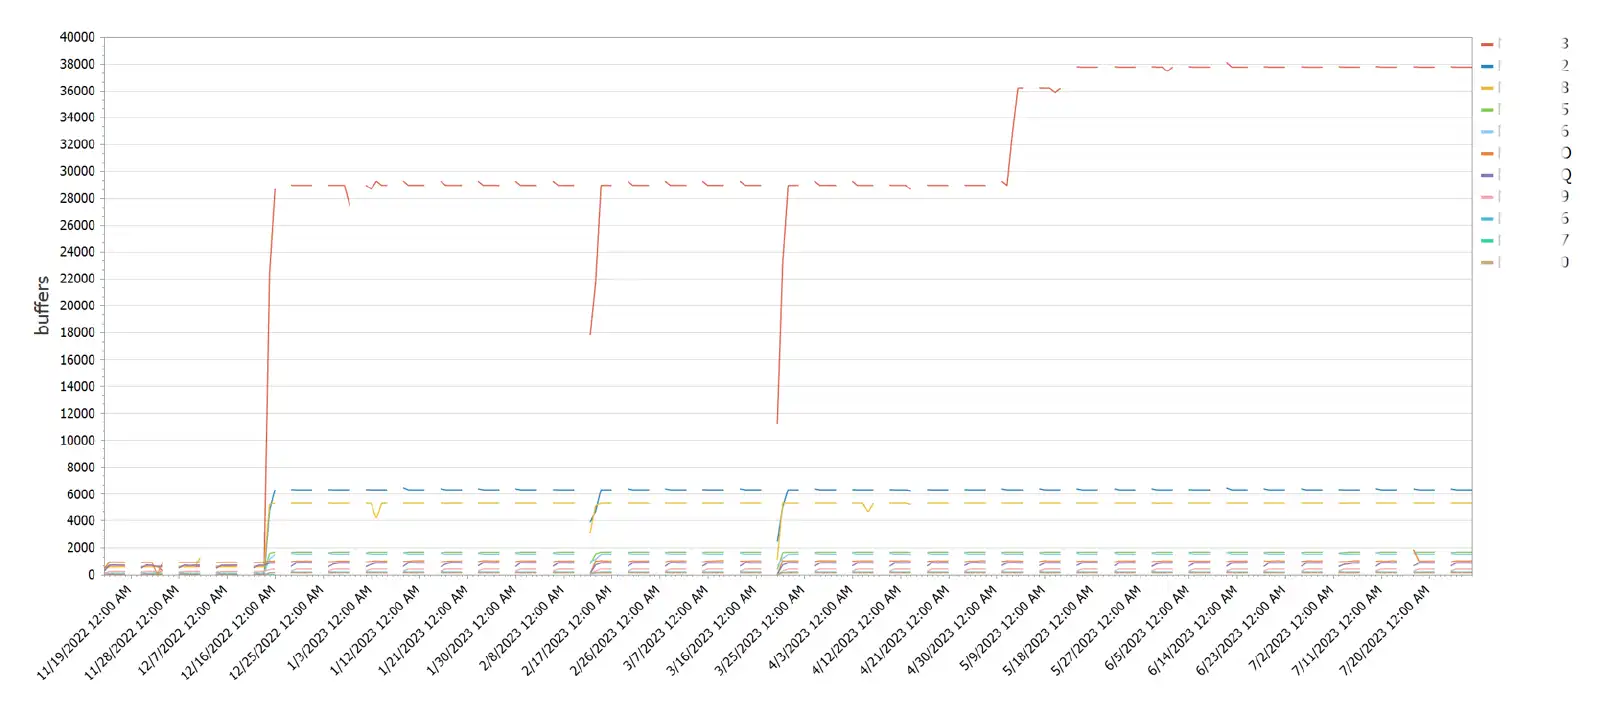
Figure 6: Defined file control data buffers by region
Big Changes in May
As with many efforts, there’s often more than one cause, and more than one action required to remedy. In this situation, a few more actions may be required, but some action was taken to reduce VSAM browse requests. This large drop coincides with the drop in CPU and TCB switch time.
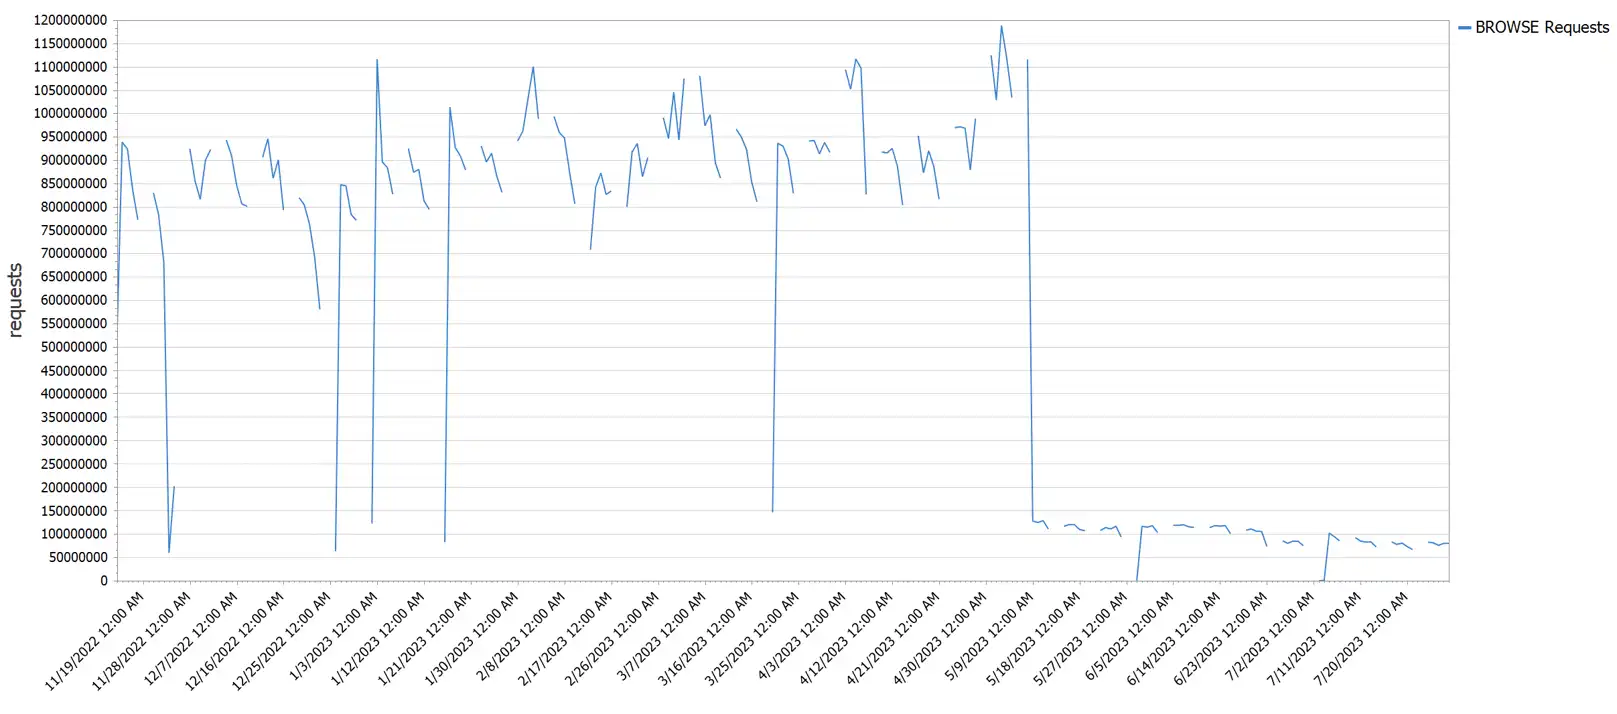
Figure 7: CICS VSAM File Browse Requests
There are more interesting details, and with so many CICS metrics and additional insights, it’s hard to keep things concise. The intent here is to keep it brief and highlight a few of the interesting points. The upshot for the system is a lower processor demand. In addition, a few key transactions are much more responsive. Specifically, the response time dropped from a peak of 700 ms, down to below 10 ms, while the CPU time went from nearly 40 ms, down to under 6 ms per transaction.
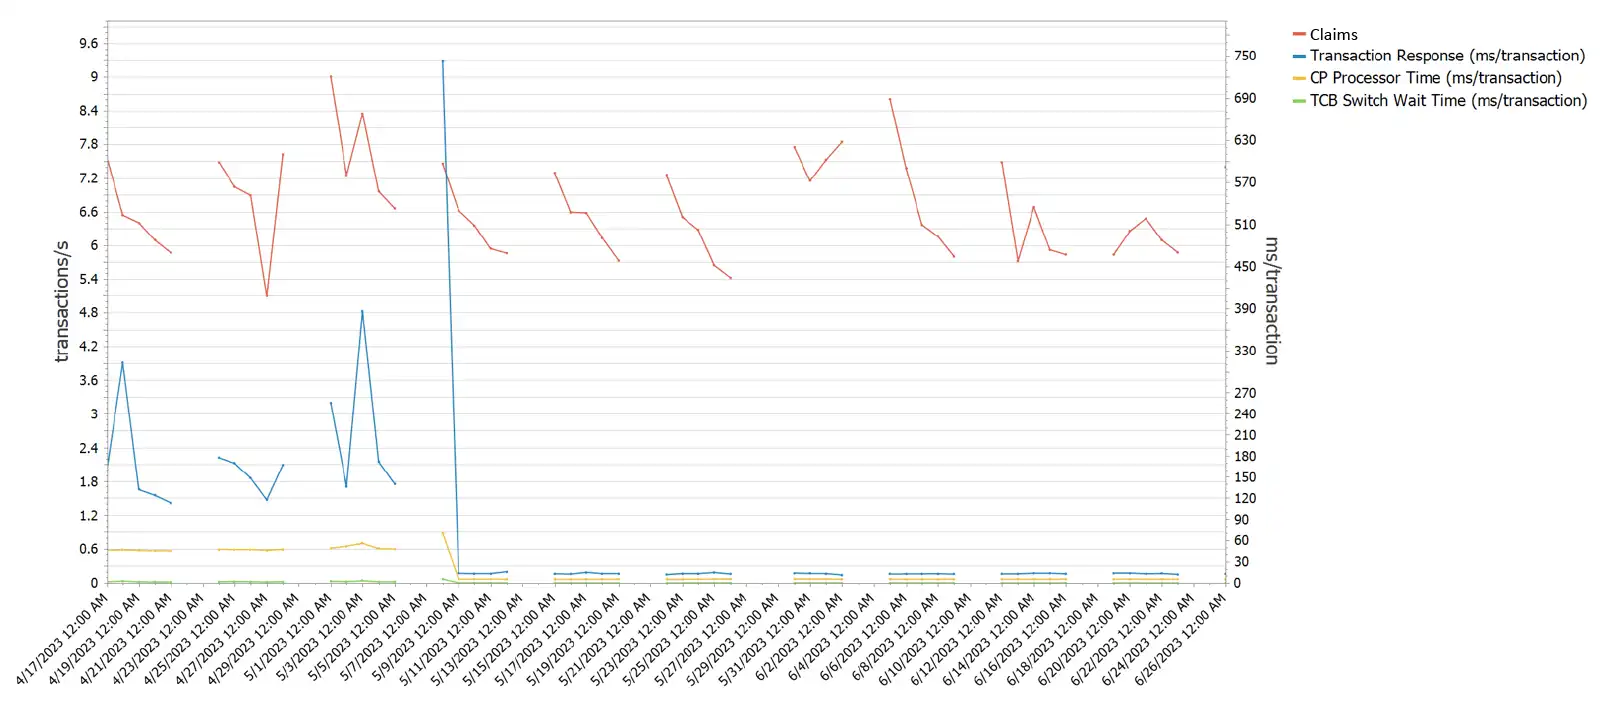
Figure 8: Claims transaction profile
Sharing the Success
The tendency of experts can be to share so many details on what was done that we lose track of the important message. How the changes reduced the TCB switch time, which in turn saved a ton of CPU, up to 2,000 seconds. This part of the story was intended to share some of the details and provide some incentive to proactively look for changes in workloads before problems arise. I look forward to sharing a bit more on effectively sharing the success in an upcoming blog. We would love to help you find the ‘nuggets’ quicker and would welcome an opportunity to share the kinds of insights that will help you deliver more for less!
This article's author
 Jack Opgenorth
 Share this blog

You May Also Be Interested In:
What's New with IntelliMagic Vision for z/OS? 2024.2
February 26, 2024 | This month we've introduced changes to the presentation of Db2, CICS, and MQ variables from rates to counts, updates to Key Processor Configuration, and the inclusion of new report sets for CICS Transaction Event Counts.
Viewing Connections Between CICS Regions, Db2 Data Sharing Groups, and MQ Queue Managers
This blog emphasizes the importance of understanding connections in mainframe management, specifically focusing on CICS, Db2, and MQ.
Enhanced Analysis Through Integrating CICS and Other Types of SMF Data | IntelliMagic zAcademy
This webinar aims to enhance your understanding of how integrating SMF data enriches insights across various z/OS components.
Book a Demo or Connect With an Expert
Discuss your technical or sales-related questions with our mainframe experts today