
Does Better Security Create Siloed Teams?
There are numerous layers within Enterprise IT to protect our data and applications. This often drives complexity and also puts some necessary boundaries between applications and data. When there is a problem it’s no wonder the network guy says, “we don’t have any issues, it must be the server folks,” and the server (including mainframe) folks say, “we don’t have any issues, it must be the network.” OR maybe we have all gotten smarter and say, “it’s the application folks – what did they change now?”
While IT security has improved with better methodologies and technologies, new traffic flows that show up may not be using current ciphers or maybe the traffic is just spurious. Can you quickly determine a cause in higher network traffic and mitigate or plan for the resulting impacts?
How often do you look at your address space data along with your TCP/IP traffic information?
How often does your application team notify the performance team that they are changing ciphers? It may not be something that you ever want to hear about with all of the other changes that may cause impacts. Assuming you are in the loop, have they coordinated it with the CICS team, the MQ team, and so on down the line? Even if they did, and you were made aware of the date, it is very likely the actual change date doesn’t line up with the date the traffic shows up.
Mainframe Performance Analysts Have Too Much Data to Evaluate
A primary concern in the above scenario is that most mainframe performance analysts have thousands and thousands of address spaces to evaluate and thousands of changes to consider in a week.
One of the most effective ways to manage the nearly infinite enterprise interactions is by automatically assessing specific meaningful metrics that have been curated by experienced professionals. This allows analysts to cover the oceans of possible meaningful data into much more manageable and actionable information. By quickly reviewing the health of critical metrics with several views like the one below you can ensure the availability of the enterprise is healthy and invest some time evaluating other variations in workload that may cause problems later if nobody intervenes.
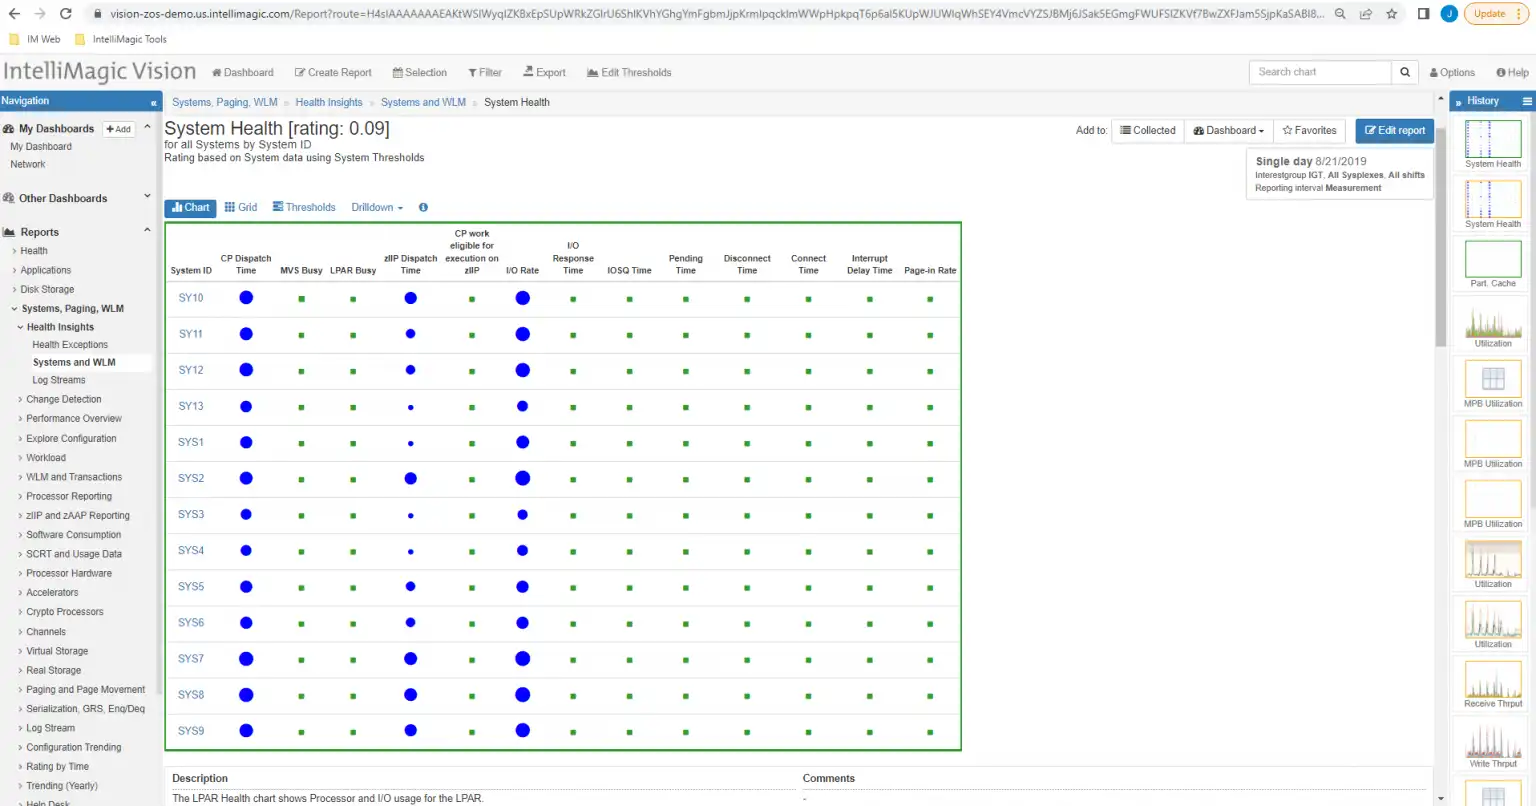
Figure 1: Automated assessments save time
Next Level Analysis
One next level challenge that you may not have considered is associating specific SMF metrics from address space data (SMF type 30) to network data metrics (SMF type 119). This just further multiplies the infinite combinations and might drive a more siloed approach or relax the bar for breadth of analysis.
A better solution can enable collaboration between silos for large shops and give the little guy an opportunity to expand his influence into areas that may seem out of reach with current solutions. Associating address space data with network data is outlined in the following sections.
Anomaly Detection and Statistical Analysis
One way to improve your game is with Change Detection.
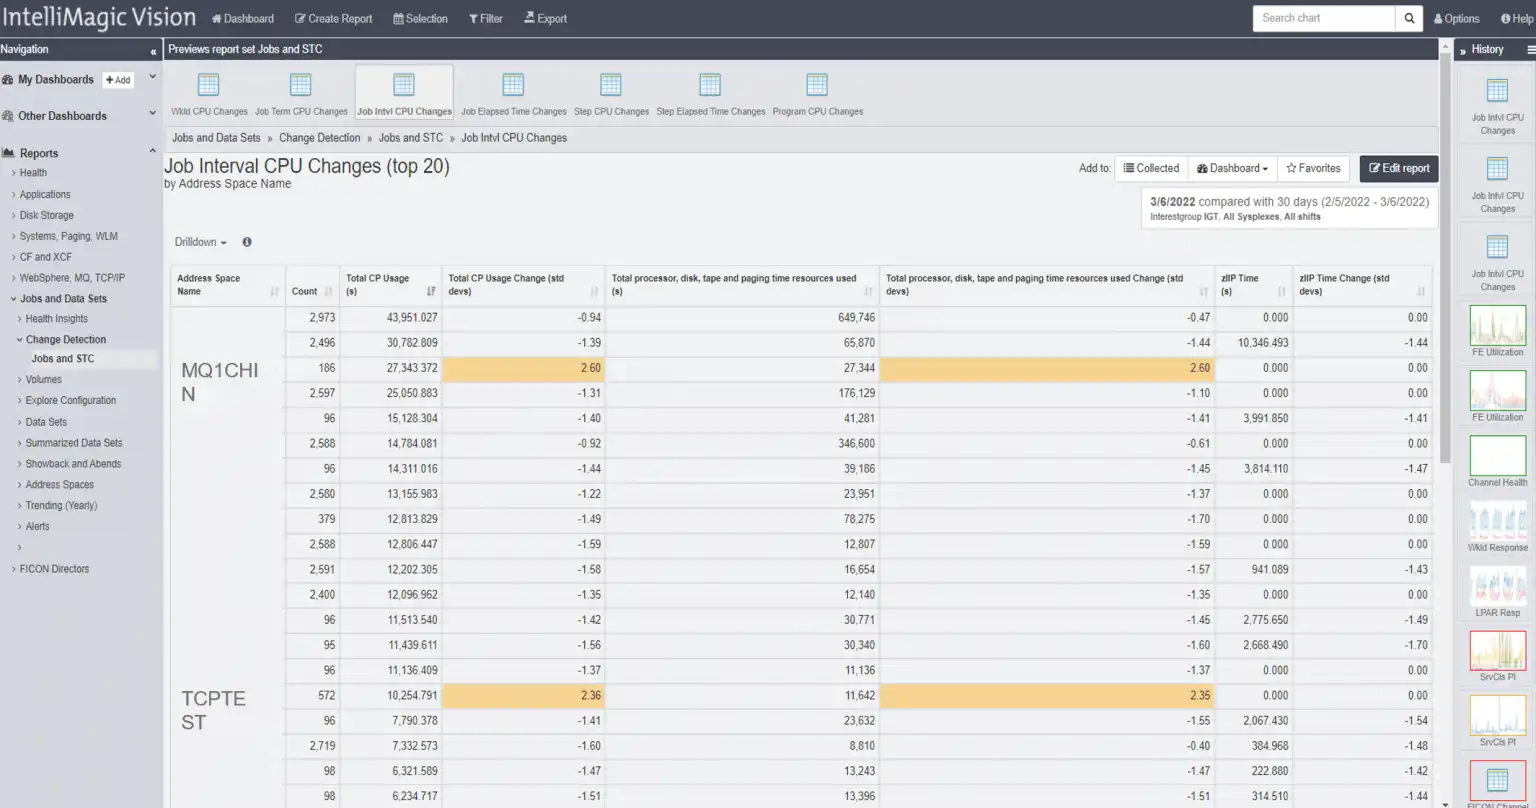
Figure 2: Address space Change Detection
Figure 2 demonstrates Change Detection views for Job Interval CPU Changes by Address Space. Change Detection identifies statistically significant changes in application and system behavior, allowing you to identify and possibly resolve an issue before the change impacts your application performance.
By leveraging this technique to evaluate statistically significant changes in a pre-production test system, you can often prevent a long day on the phone. Incident calls consume hours of time where many SMEs, operators, and engineers report in with their evidence from disparate solutions until remediation is applied. Highlighting changes in CPU consumption for address spaces seems to be a daunting ordeal for a human analyst, however, this is trivial for a machine.
TCP/IP Traffic Reporting to Security Protocol Level
Identifying significant changes in address spaces is helpful at a lower level, but how can we identify what traffic might be causing the change?
Having TCP/IP traffic reporting with drilldowns at the security protocol level is great when looking into other changes in the network traffic arena. Coupling this with additional drilldown information and comparing it to other days, one can quickly identify the security protocol by system and begin remediation.
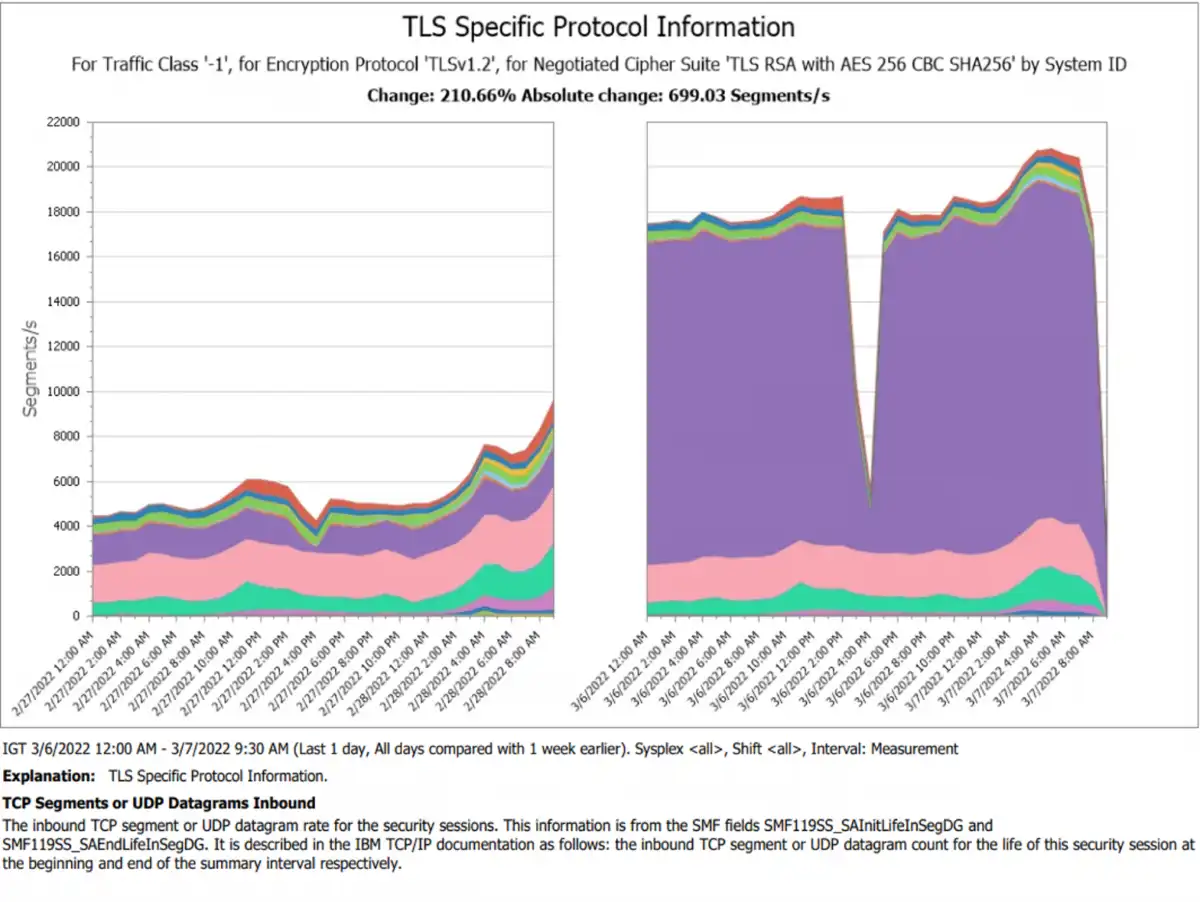
Figure 3: TCP/IP security protocol traffic before and after change comparison
The report in Figure 3 provides a focused look at network traffic (segment throughput) by system for a particular encryption protocol and cipher suite. The performance analyst at this stage has enough insight to act, but it’s not likely the performance analyst is aware that there may be some improvement required in the security of this traffic.
In addition, the ability to zero in on the protocol and cipher provides some details that can give actionable insights about the security of the new traffic in question. Is the cipher current for the new traffic? If it’s not approved, the security team can act on this and ensure production traffic for this new source meets your standards before the application moves to production.
Once a use case like this unearths new communication, improved collaboration linking previously siloed teams becomes more likely. This use case includes a dialogue where successful problem resolution helps you say things like:
- “The matter with MQ1CHIN is resolved.”
- “Also, the CBC cipher in use is not an approved SEC cipher so we should be working on a plan to move to newer ciphers and removal of anything with TLS_RSA or CBC.”
Collaborative Solutions Enable Effective Delivery
A combined reporting medium that fosters collaboration like this can be easily adopted to build on the use case learnings. An example of integrating multiple sources of SMF data is shown in the dashboard below and this enables a more systematic approach that combines distinct metrics from different SMF types being delivered on a dashboard.
This group of reports will continue to highlight these types of changes when they are occurring. Improved collaboration among all the teams involved will help your organization improve development cycle time and keep your enterprise safe and efficient.
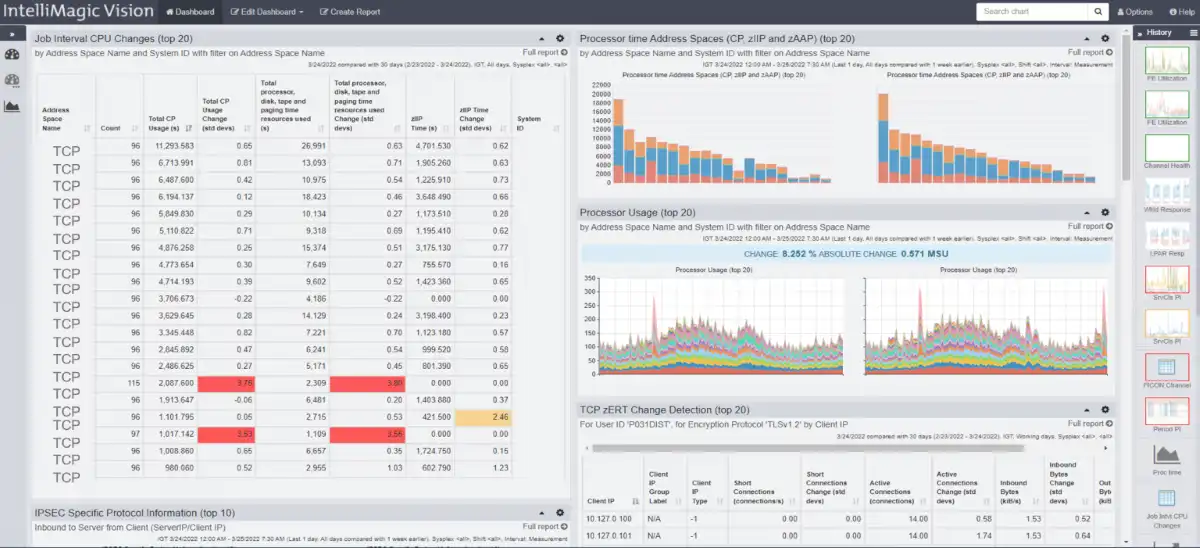
Figure 4: Putting it all together with a custom dashboard
In summary, this example demonstrates a collaborative approach that integrates security and performance and includes applications, systems, and network teams.
A common solution that visualizes specific metrics across technical silos helps foster effective communication so that remediation and ongoing methodology improvements deliver timely responses to the constant changes to your infrastructure and applications, without sacrificing the safety of your IT systems.
This article's author
 Jack Opgenorth
 Share this blog
You May Also Be Interested In:
What's New with IntelliMagic Vision for z/OS? 2024.1
January 29, 2024 | This month we've introduced updates to the Subsystem Topology Viewer, new Long-term MSU/MIPS Reporting, updates to ZPARM settings and Average Line Configurations, as well as updates to TCP/IP Communications reports.
Banco do Brasil Ensures Availability for Billions of Daily Transactions with IntelliMagic Vision
Discover how Banco do Brasil enhanced its performance and capacity management with IntelliMagic Vision, proactively avoiding disruptions and improving cross-team collaboration.
Making Sense of the Many I/O Count Fields in SMF | Cheryl Watson's Tuning Letter
In this reprint from Cheryl Watson’s Tuning Letter, Todd Havekost addresses a question about the different fields in SMF records having different values.
Book a Demo or Connect With an Expert
Discuss your technical or sales-related questions with our mainframe experts today