
This blog was originally published on March 19, 2018.
A prominent theme among IT organizations today is an intense focus on expense reduction. For mainframe departments, this routinely involves seeking to reduce software expense from IBM and other vendors, which commonly represents the dominant portion of the infrastructure outlay for the platform.
This is the second article of a four-part series focusing on an often-overlooked topic that has the potential to achieve significant cost savings, namely processor cache optimization. (You can read the first article here: Lower MLC Software Costs with Processor Cache Optimization.) Without an understanding of the vital role processor cache plays in CPU consumption and clear visibility into the key cache metrics in your environment, significant opportunities to reduce CPU consumption and software expense may not be realized.
Note that this correlation between reduced CPU and cost savings applies to all of today’s widely used software license models, both those based on peak four-hour rolling average (4HRA) and to an even greater extent those that charge for all general-purpose CPU (Tailored Fit Pricing’s Enterprise Consumption).
To briefly recap the key findings from the first article: improving cache efficiency reduces machine cycles spent waiting for data and instructions to be staged into Level 1 cache, as reflected in lower Finite CPI. Work executing on Vertical High (VH) logical CPs optimizes cache effectiveness, because its 1:1 relationship with a physical CP means its data is more likely to be immediately or quickly accessible in processor cache.
HiperDispatch uses two factors to determine the vertical CP configuration[1]: (1) LPAR weights, and (2) the number of physical CPs on the processor.[2] This article focuses on that first factor – how LPAR weights can be optimized to increase the amount of work executing on VHs.[3] The next article in the series will address considerations for configuring processor hardware to enhance cache efficiency and reduce CPU.
Optimizing LPAR Weights to Maximize Work Executing on VHs
There are several potential ways to maximize work on VHs through setting LPAR weight values.[4]
(1) For LPARs with a guaranteed share greater than 1 and a fractional share slightly below 0.5 (e.g., 8.4), a small weight adjustment can create an additional VH. This can be especially helpful on large LPARs with a significant workload currently executing on VMs and VLs.
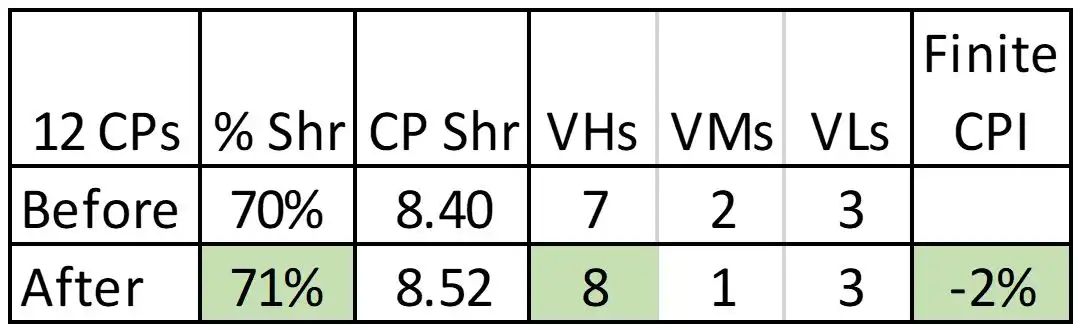
Figure 1: LPAR Weight Change on Large LPAR
Figure 1 shows an example where changing the weight from 70 to 71 percent was sufficient to increase the number of VHs from seven to eight. This resulted in a measured decrease in Finite CPI of two percent for a given measurement interval, which correlated to a CPU reduction of one percent. One percent less CPU on a large LPAR can translate into a meaningful reduction in software expense, especially when compared with the level of effort required to identify and implement this type of change. Benefits from tuning LPAR weights typically produce single-digit percentage improvements as in this case, but there can be larger opportunities, as seen in what follows.
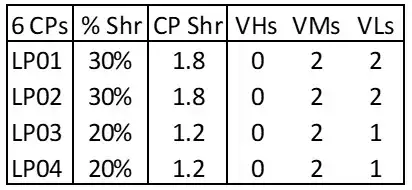
Figure 2: LPAR Weight Configuration With 0 VHs
(2) Specialized situations may provide additional opportunities to tailor LPAR weights to increase the overall number of VHs assigned by PR/SM on a processor. The LPAR weight configuration of 30/30/20/20 percent shown in Figure 2 appears routine, but unfortunately, on a z13 it results in zero VHs.[5]
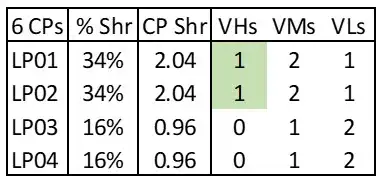
Figure 3: Adjusted LPAR Weights Creating 2 VHs
As Figure 3 shows, relatively small LPAR weight changes would increase the number of VHs on this processor from zero to two, increasing the amount of work eligible to execute on VHs from zero to 33 percent. On comparable systems in this environment, the Finite CPI for work executing on VHs was 20 percent lower than work on VMs, so this change would significantly reduce CPU consumption on this processor.
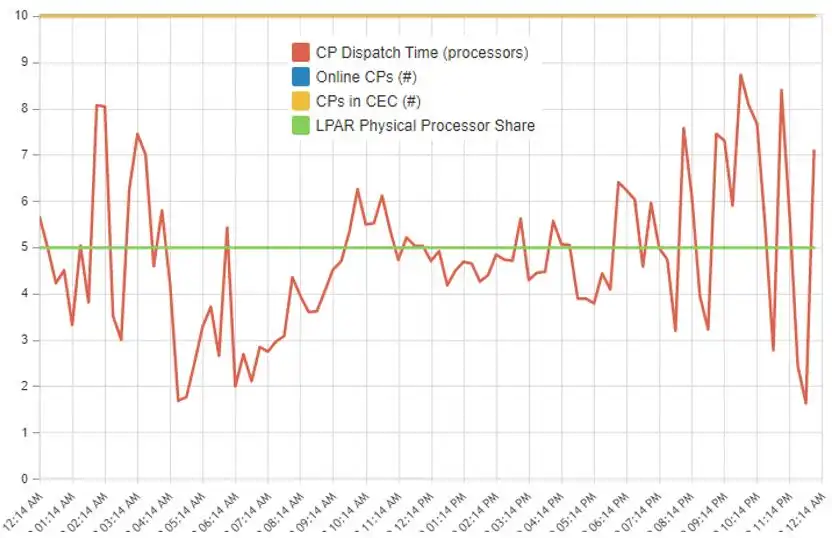
Figure 4: Engine Dispatch Analysis
(3) If activity levels on an LPAR change significantly between shifts (e.g., online workload during day vs. batch at night), automating LPAR weight changes corresponding to those shifts may provide opportunities to increase the workload executing on VHs. The Engine Dispatch Analysis view shown in Figure 4 can help identify if there are repeatable intervals when CPU consumption (shown in red) exceeds the LPAR’s guaranteed share (in green). When this is the case, weight changes to better align the guaranteed share with the anticipated workload can help reduce the size of workloads executing sub-optimally on non-VH logical CPs.
(4) Avoid activating idle LPARs with large weights or failing to deactivate idle LPARs after testing has been completed. Both scenarios can have a significant negative impact on cache and CPU efficiency.
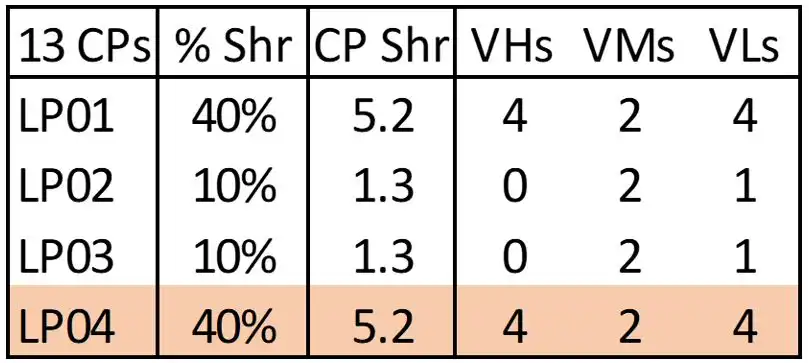
Figure 5: Idle LPAR with Production Weight
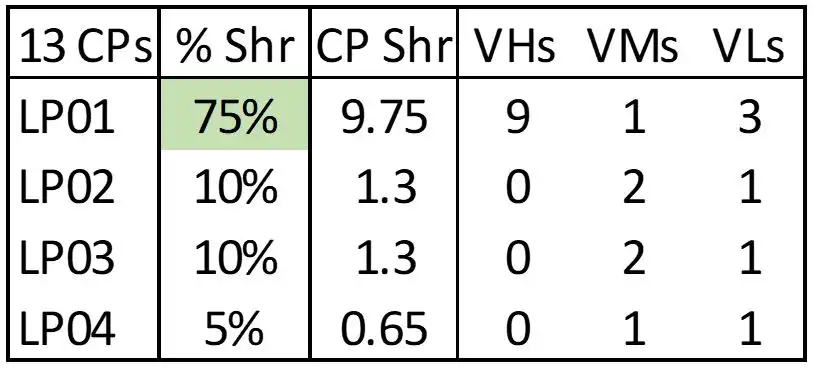
Figure 6: Production LPAR with Production Weight
In the scenario shown in Figure 5, planning was underway for a configuration change to split the primary Production workload across two LPARs. To prepare for the change (which would go live in a few months) a new LPAR (LP04) was defined and activated with a production weight. The opportunity here is that the entire Production workload was still executing on LP01, which now only had access to 4 VHs, so that a sizable workload was executing on VMs and VLs. Changing the LPAR weights to reflect the current workload configuration (Figure 6) enabled the Production LPAR to leverage 9 VHs instead of 4. This reduced total CPU consumption for that Production workload by more than 5%, which translated into a 6-figure annual reduction in MLC expense in this environment.
At another site, again while preparing for upcoming configuration changes, new soon-to-be Production LPARs were activated to validate the I/O configurations. But instead of being activated with “validate an I/O configuration” weights they were activated with their ultimate Production weights. This significantly impacted the vertical CP configurations of the live Production LPARs, resulting in a 20% increase in CPU consumption across multiple Production systems.
I recently observed another variation on this theme, where LPARs were activated to conduct testing anticipated to last less than one week. However, due to a coordination lapse between teams, those idle LPARs remained activated 4 months after the testing had been completed, costing this site 5 VHs on a production CPC over that entire time period.
It is important that everyone authorized to activate LPARs at your site realizes the impact LPAR weights have on the vertical CP configuration. This is a potential CPU (and software expense) driver that is entirely avoidable.
I have repeatedly seen these issues, even in big shops with experienced staff. Without good visibility into the processor cache configurations and metrics in their environments, even senior staff fail to quickly recognize and correct these very expensive mistakes. It is important that everyone authorized to activate LPARs at your site realizes the impact LPAR weights have on the vertical CP configuration. This is a potential CPU (and software expense) driver that is entirely avoidable.
LPAR Topology
In addition to avoiding cross-LPAR contention for cache from other LPARs, an additional benefit of maximizing work on VHs is its positive impact on LPAR topology. PR/SM dynamically assigns LPAR CPs and memory to hardware chips, nodes and drawers seeking to optimize cache efficiency. This topology can have a very significant impact on processor performance because remote cache accesses can take hundreds of machine cycles.
![Figure 7. z14 Drawer Cache Architecture [Hutton2020]](https://www.intellimagic.com/wp-content/uploads/Article-2-Havekost-Figure-7.webp)
Figure 7: z14 Drawer Cache Architecture [Hutton2020]
A z13, z14, or z15 processor has up to five CPU drawers (depending on the model), along with some number of I/O drawers. Figure 7 (reflecting one CPU drawer on a z14) provides a framework for the following discussion.[6] Each active physical CP (labeled “PU” on Figure 7) has its own dedicated Level 1 and Level 2 cache.
When a unit of work executing on a CP on a given Single Chip Module (SCM) accesses data in Level 3 (L3) cache (the first level that is shared across multiple CPs), that access can be on its own SCM chip, “on drawer” (on a different SCM in this drawer) or “off drawer” (on a different drawer in the processor). The more remote the access, the greater the number of machine cycles required. Similarly, accesses to L4 cache and to memory can be “on drawer” or “off drawer.”
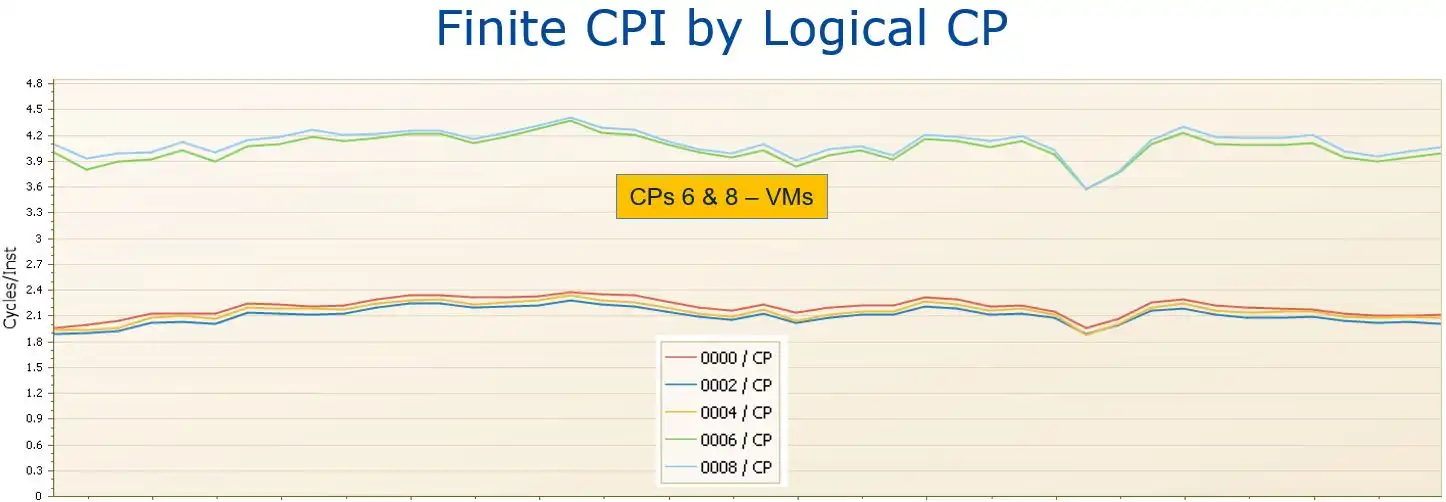
Figure 8: Finite CPI by Logical CP – Adverse LPAR Topology
An example showing the potential impact of LPAR topology on Finite CPI is illustrated by Figure 8. Note that the Finite CPI values for the two VM logical CPs (CPs 6 and 8) on this system were significantly higher than those for the VHs. The atypical[7] magnitude of this system’s gap in Finite CPI between its VHs and VMs, which we might call the “VM penalty”, reflects an adverse LPAR topology where the VMs are likely located in a different drawer from the VHs.[8] When references by these VMs to data in shared levels of cache (Level 3 and above) are required to traverse across drawers to access data that has been staged by the VHs, those accesses can take hundreds of machine cycles.
Thus, the practical outcome of adverse LPAR topology is that workload not executing on VHs can experience Finite CPI values significantly higher[9] than work executing on VHs. In an environment where Finite CPI (“waiting cycles”) constitutes half of total CPI, a 40% higher Finite CPI translates into work executing on VM/VL logical CPs consuming 20% more CPU.
When there is a significant disparity between the Finite CPIs for VMs and VHs on the same system, an investigation of the LPAR topology is warranted.[10] Since PR/SM prioritizes collocating VHs, work executing there avoids the waiting cycles associated with cross-node or cross-drawer accesses that can be experienced on VMs. This, in addition to avoiding cross-LPAR contention for cache from other LPARs, is another benefit of maximizing work executing on VHs,
Recap
The z13 ushered in an era where limited potential for cycle speed improvements translates into processor cache efficiencies playing an ever-increasing role in the capacity increases delivered by each new Z processor generation. And since “waiting on cache” cycles represent a significant portion of overall CPI, effectiveness in optimizing CPU at the infrastructure level requires understanding key processor cache concepts and having good visibility into the key cache metrics.
In the next article in this series, we will explore options and considerations for configuring processor hardware to enhance cache efficiency and reduce CPU.
Read Part 3: Reducing Software Expense by Optimizing Processor Configurations
Sources
[Havekost2020a] Todd Havekost, “Potential Software Expense Savings Through Processor Cache Optimization,” Enterprise Tech Journal, 2020 Issue 4.
[Havekost2020b] Todd Havekost, “Optimizing Processor Cache on z13 / z14 / z15 Processors,” SHARE Session #26688, February 2020.
[Hutton2020] David Hutton, “The Hitchhiker’s Guide to MIPS and Capacity Planning,” SHARE Session #26994, February 2020.
[Maneville2020] Alain Maneville, LPAR Design Tool, https://github.com/AlainManeville/z-OS-LPARDesign
[Snyder2016] Bradley Snyder, “z13 HiperDispatch—New MCL Bundle Changes Vertical CP Assignment for Certain LPAR Configurations,” IBM TechDoc 106389, June 2016.
[1] I.e., the number of Vertical High (VH), Vertical Medium (VM), and Vertical Low (VL) logical CPs defined to the LPAR.
[2] See [Havekost2020b] for the details on how HiperDispatch uses these 2 factors to determine the vertical CP configuration.
[3] The primary purpose of LPAR weights is to determine the “guaranteed share” of CPU available to that LPAR, and thus must specify a value sufficient to support the LPAR’s workload.
[4] See [Maneville2020] for a very helpful IBM as-is tool that identifies opportunities to optimize LPAR weights.
[5] This is a special case on the z13, where to avoid separating logical CPs across drawers PR/SM favors 2 VMs over 1 VH + 1 VM [Snyder2016].
[6] There are small architectural differences between the generations, but the overall framework is very similar. Design changes in the z14 and z15 that enhance cache efficiency will be covered in the final article in the series.
[7] Finite CPI data for systems with a comparable workload but having VHs and VMs located in the same drawer showed a much smaller gap between VH and non-VH values.
[8] This was confirmed for this example by the drawer/node/chip location data provided for each logical CP in the SMF 99.14 records.
[9] I have observed Finite CPI VM penalties exceeding 80%.
[10] Cache design improvements in z14 and z15 models minimize the likelihood of GCP VHs and VMs being assigned in separate drawers, as will be covered in the fourth article.
How to use Processor Cache Optimization to Reduce z Systems Costs
Optimizing processor cache can significantly reduce CPU consumption, and thus z Systems software costs, for your workload on modern z Systems processors. This paper shows how you can identify areas for improvement and measure the results, using data from SMF 113 records.
This article's author
 Todd Havekost
 Share this blog
Related Resources
Why Am I Still Seeing zIIP Eligible Work?
zIIP-eligible CPU consumption that overflows onto general purpose CPs (GCPs) – known as “zIIP crossover” - is a key focal point for software cost savings. However, despite your meticulous efforts, it is possible that zIIP crossover work is still consuming GCP cycles unnecessarily.
Top ‘IntelliMagic zAcademy’ Webinars of 2023
View the top rated mainframe performance webinars of 2023 covering insights on the z16, overcoming skills gap challenges, understanding z/OS configuration, and more!
Making Sense of the Many I/O Count Fields in SMF | Cheryl Watson's Tuning Letter
In this reprint from Cheryl Watson’s Tuning Letter, Todd Havekost addresses a question about the different fields in SMF records having different values.
Book a Demo or Connect With an Expert
Discuss your technical or sales-related questions with our mainframe experts today