
One of the challenges of performance data is to interpret SMF and RMF data in terms of your applications. Yet, application performance is what really matters, so it is important to get that perspective.
In addition to insight from the z/OS infrastructure perspective, IntelliMagic Vision provides information on how the applications are using your systems. For the z/OS infrastructure staff, this makes it a lot easier to understand which applications are using resources like the Coupling Facility and XCF. For the application staff, it gives insight in what might cause delays at the application level.
Monitor and Understand Application Behavior on the Mainframe
It is also very helpful to understand application behavior: to assess whether the load on processor, storage, Coupling Facility etc. is indeed as expected. If not, this may be a symptom of a wrong configuration setting causing z/OS or the application to do too much work, or it may point to an inefficiency in the application. In many cases, such issues are easy to fix once identified.
Until now, it was very hard to do this kind of analysis. Measurement data from applications typically do not cover all hardware resources used and assigning the hardware (RMF/SMF) data to applications is not trivial either.
IntelliMagic Vision handles the second part: it shows the relationship between applications, resources and transactions, providing application centric reporting for regular SMF data.
Application Centric Reporting for SMF Data
The IntelliMagic Vision application support automatically categorizes your workload by application for as many aspects as possible. For example, a Coupling Facility dashboard from the Application perspective would show applications instead of structures at the highest level.
The big challenge with application reporting is that every installation is different. Naming conventions are different, reporting requirements are different, and what is important for each installation can be different too.
Yet, there are also many commonalities. More and more installations aim to use IBM defaults such that customization efforts are limited. For example, the Global Resource Serialization address space will almost always be called GRS. For Coupling Facility structures, we see similar defaults; a structure name that starts with IST is very likely used by VTAM.
Based on observations like this, IntelliMagic Vision comes with a starter set of definitions to give you out-of-the-box valuable application reports. These will not cover everything that matters to you, e.g. it may group test and production CICS regions together, but it should give a good starting point for further customization.
Figure 1 provides an example of a dashboard with Coupling Facility structures grouped by application.
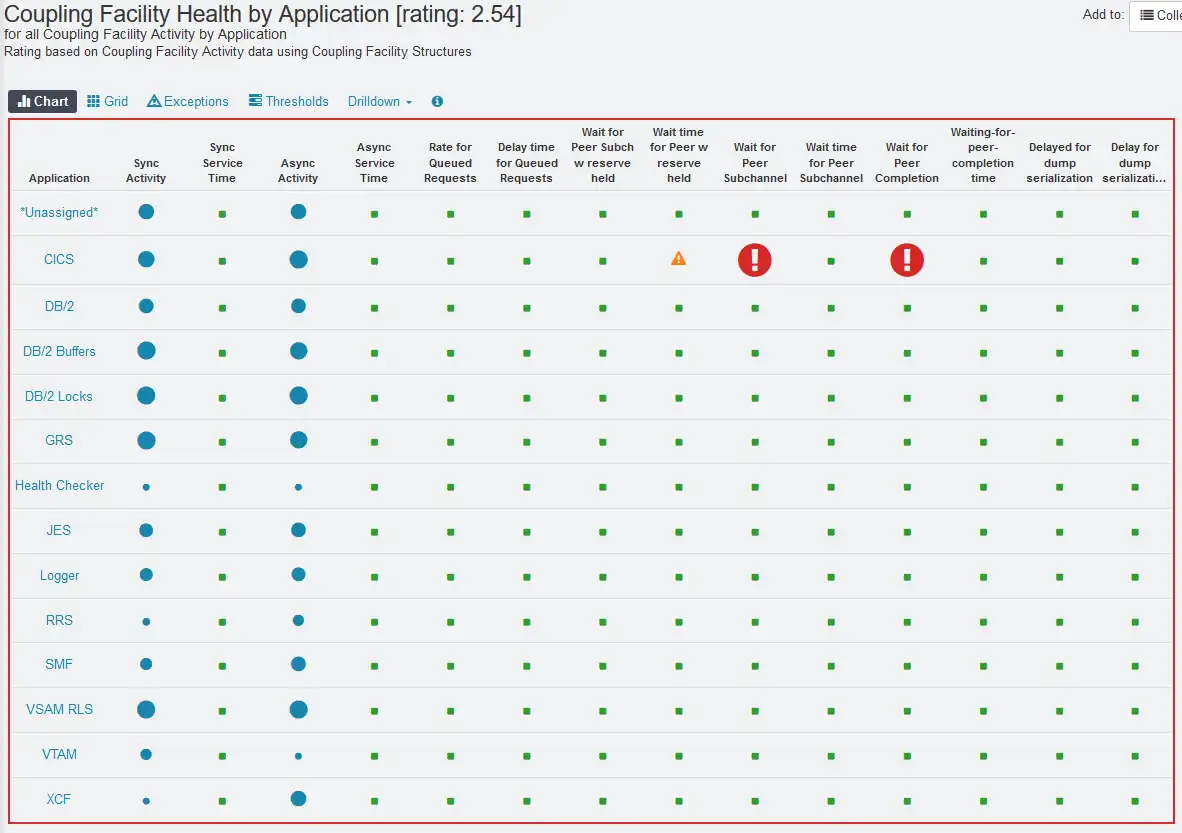
Figure 1 – Coupling Facility Health by Application
Separate report types are provided to help you with the customization efforts for your installation, such that the majority of your workload is categorized.
Our white paper, How to use the Application Groups in IntelliMagic Vision goes into extensive detail of how to implement the Application feature for your installation, as well as sample reports, definitions, and reporting examples.
Application Viewpoints
Application support is very helpful to understand application performance and behavior on the mainframe: to assess whether the workload and service levels for the processor, storage, Coupling Facilities etc., are indeed as expected for each individual application or application group.
The built-in rules that group applications immediately provide insight in what keeps your Coupling Facility and Cross-system XCF links busy. The concept also allows you to add your own site-specific rules to create insightful reports that match the way you run your business.
With the Applications Focal Point in IntelliMagic Vision, there are additional viewpoints available for:
- Applications
- CICS
- Db2
- IMS
- MQ
- VSAM RLS
- Design Validation
I will cover each of these Applications viewpoints in subsequent blogs.
How to use the Applications Groups in IntelliMagic Vision
Read this white paper to learn how to easily understand the performance and behavior of your z/OS applications.
This article's author
 Dr. Gilbert Houtekamer
 Share this blog
Related Resources
What's New with IntelliMagic Vision for z/OS? 2024.1
January 29, 2024 | This month we've introduced updates to the Subsystem Topology Viewer, new Long-term MSU/MIPS Reporting, updates to ZPARM settings and Average Line Configurations, as well as updates to TCP/IP Communications reports.
What's New with IntelliMagic Vision for z/OS? 2024.2
February 26, 2024 | This month we've introduced changes to the presentation of Db2, CICS, and MQ variables from rates to counts, updates to Key Processor Configuration, and the inclusion of new report sets for CICS Transaction Event Counts.
Top 10 IntelliMagic Vision Features Released in 2023
With over 160 announced product updates, 2023 was a spectacular year of releases for users of IntelliMagic Vision for z/OS. In this blog we try to narrow it down to the 10 most popular, helpful, and groundbreaking.
Book a Demo or Connect With an Expert
Discuss your technical or sales-related questions with our mainframe experts today