
Viewing processor topology, although oftentimes painstaking, is required to ensure that your workload is running as efficiently as possible. But it’s also important to track the processor topology changes over time to verify those changes and understand any impact that may result, such as when a new LPAR is activated or during disaster recovery testing.
In this blog I’ll cover processor topology at a high level and discuss the benefits of tracking and comparing topology changes over time – as well as one method for doing so.
Processor Topology – Quick Review
In my previous blog, I introduced the IntelliMagic Vision topology view. Here is a link to that blog: Processor Topology – A Picture Says 1024 Words.
The data used comes from RMF/CMF processor activity (SMF 70 subtype 1), the Hardware Instrumentation Services (HIS) hardware capacity statistics (SMF 113 subtype 1) and the System Resource Manager (SMF 99 subtype 14 HiperDispatch) records.
Looking at only a single LPAR, such as in Figure 1 below, we can see the processor topology (processor polarity, chips, clusters and drawers) for the general purpose processors and also the specialty processors (e.g. zIIPs). We can see the polarity for each processor (Vertical High, Medium or Low) and that SMT is being used for the zIIP processors (multiple logical processors per core).
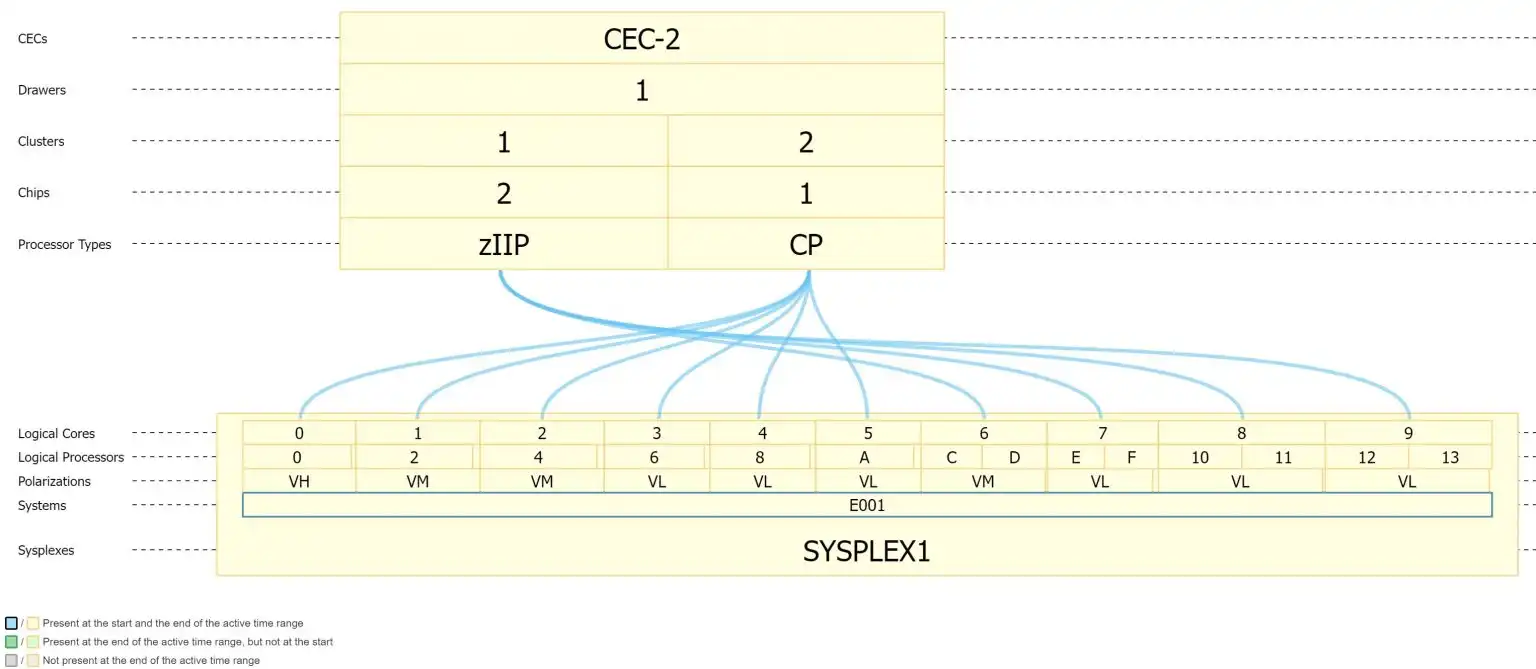
Figure 1: Processor Topology
This provides a nice visual view of what the processor topology looks like right now.
But what if we had changes? How can we see what changed and possibly impacted our workload efficiency?
Viewing Processor Topology Changes
The assignment/placement of processors can take place many times during the day, especially if IRD (Intelligent Resource Director) is being used. The new enhanced processor topology view in IntelliMagic Vision shows us changes during the day or during a selected timeframe.
Changes can be the processor assignment (e.g. movement between drawers) or simply processor polarity changes (e.g. Vertical High to Vertical Medium). It can be very enlightening to observe, for example, what the assignment looks like during the early morning time period compared to the production time frame, as seen in Figures 2 and 3 below.
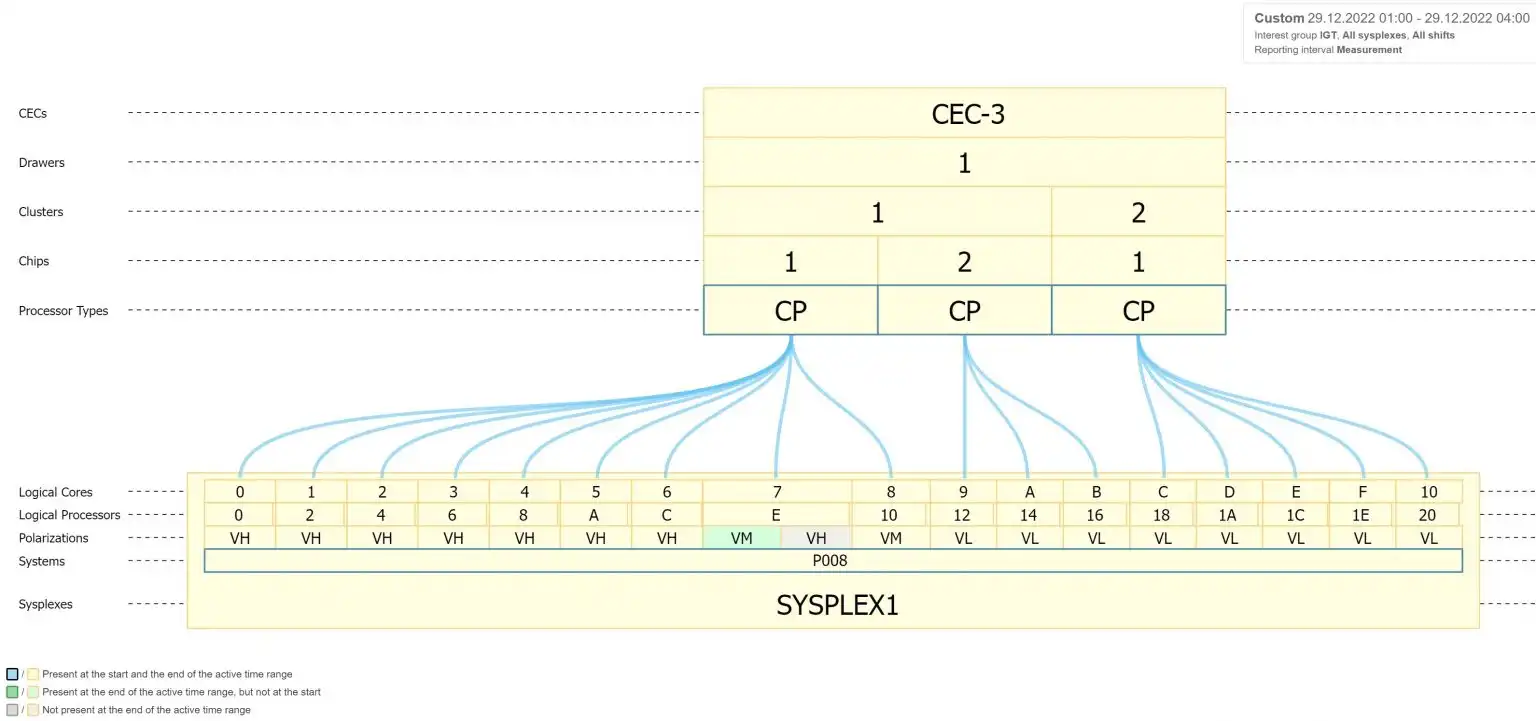
Figure 2: Early morning time period
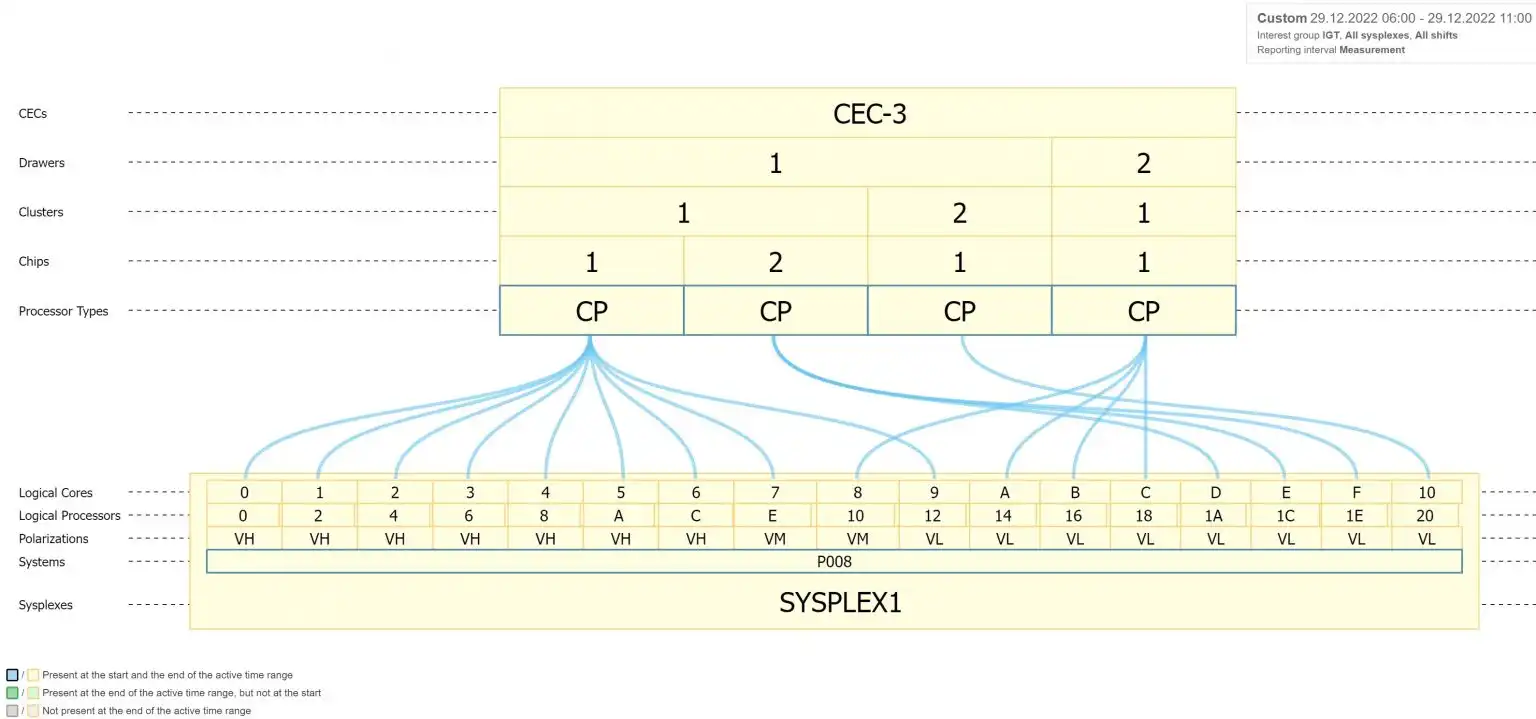
Figure 3: Production time period
Note: Different colors are used to show us changes during the selected time frame.
We can see that logical processors 10 through 18 have moved to a different drawer. This may have repercussions when work is dispatched across different logical processors and moves between drawers (i.e. inefficiencies due to cache misses).
Understanding what is happening during the day is vital if you want to ensure that your production workload is getting the type of resources required and is running as efficiently as possible.
Comparing Processor Topology Over Time
Comparing two days can reveal very interesting changes to the processor topology. These changes may be planned and desired, or they may be accidental and potentially negative.
Let’s look at a comparison of a specific LPAR on two distinct days.
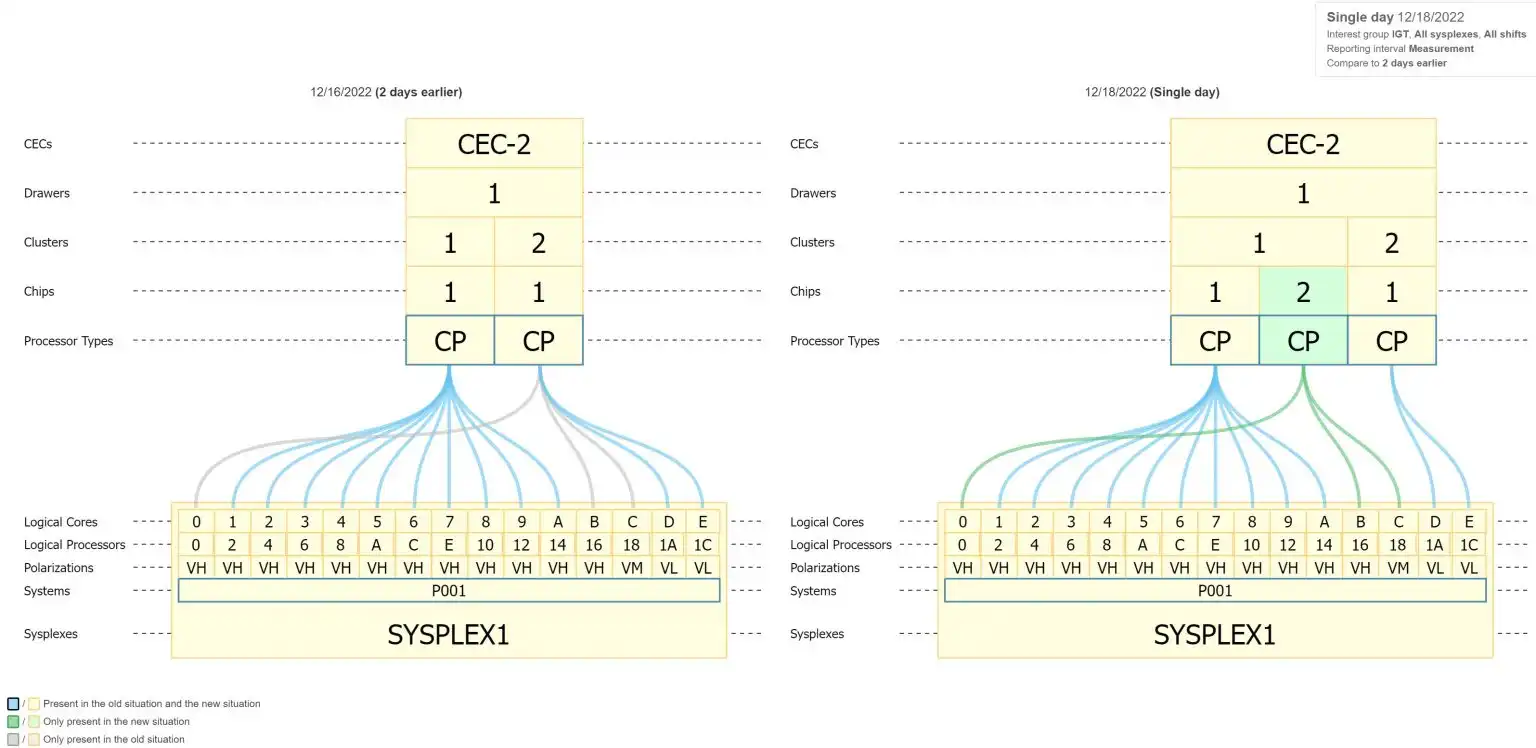
Figure 4: Comparing of two days
Note: Hovering over one of the colored lines will describe when the change occurred.
We can see that logical processors 0, 16, and 18 have moved to a different chip. This may simply be that another LPAR was activated on this CEC and the processor assignments for this LPAR were changed.
When looking to minimize your workload costs, it is important to correctly understand what the processor topology looks like for the LPAR and ensure that it remains in the desired configuration.
Summary
Observing processor topology is very important to ensure that your workload is running as efficiently as possible. The processor topology can change over time so there is a need to verify changes and understand any impact that may be the result of those changes.
For example: When a new LPAR is activated and IPL’d, the relative LPAR weight changes for all systems defined to that CEC and that may influence the processor polarity of CPs (both GCPs and zIIPs) assigned to all LPARs.
Another important time to observe the processor topology is when doing disaster recovery testing. Typically, many LPARs are activated on the same CEC and the order of activation does matter. It is important to activate the large production LPARs before activating others.
At IntelliMagic, we believe that having insight into complex data is important to allow you to fully understand what is happening in your installation. The processor topology view is an example of taking complicated z/OS SMF data and making it easy to understand.
The video below demonstrates interactive access with the processor topology and how it enables analysts to easily configure their processor configuration.

Job-level CPU Saving Opportunities in an Enterprise Consumption Environment
Analysts involved in leading CPU reduction efforts will have to focus limited staff resources on the top potential savings opportunities. This article focuses on job-level CPU reduction opportunities.
This article's author
 John Ticic
 Share this blog
You May Also Be Interested In:
What's New with IntelliMagic Vision for z/OS? 2024.2
February 26, 2024 | This month we've introduced changes to the presentation of Db2, CICS, and MQ variables from rates to counts, updates to Key Processor Configuration, and the inclusion of new report sets for CICS Transaction Event Counts.
From Taped Walls to Your PC: z/OS Configuration Made Simple with Topology | IntelliMagic zAcademy
In this webinar, we explore a technique that integrates diverse data sources from z/OS, presenting them in a clear, concise, and interactive visual format.
IntelliMagic Releases Breakthrough Interactive z/OS Subsystem Topology Viewer
November 6, 2023 | With the release of 12.10.0, IntelliMagic Vision has introduced an interactive z/OS Subsystem Topology Viewer, allowing performance analysts to visualize and directly interact with subsystem connections.
Book a Demo or Connect With an Expert
Discuss your technical or sales-related questions with our mainframe experts today